import {
    LiveboardEmbed,
    AuthType,
    init,
    prefetch,
    EmbedEvent
}
from '@thoughtspot/visual-embed-sdk';Embed a Liveboard
Table of Contents
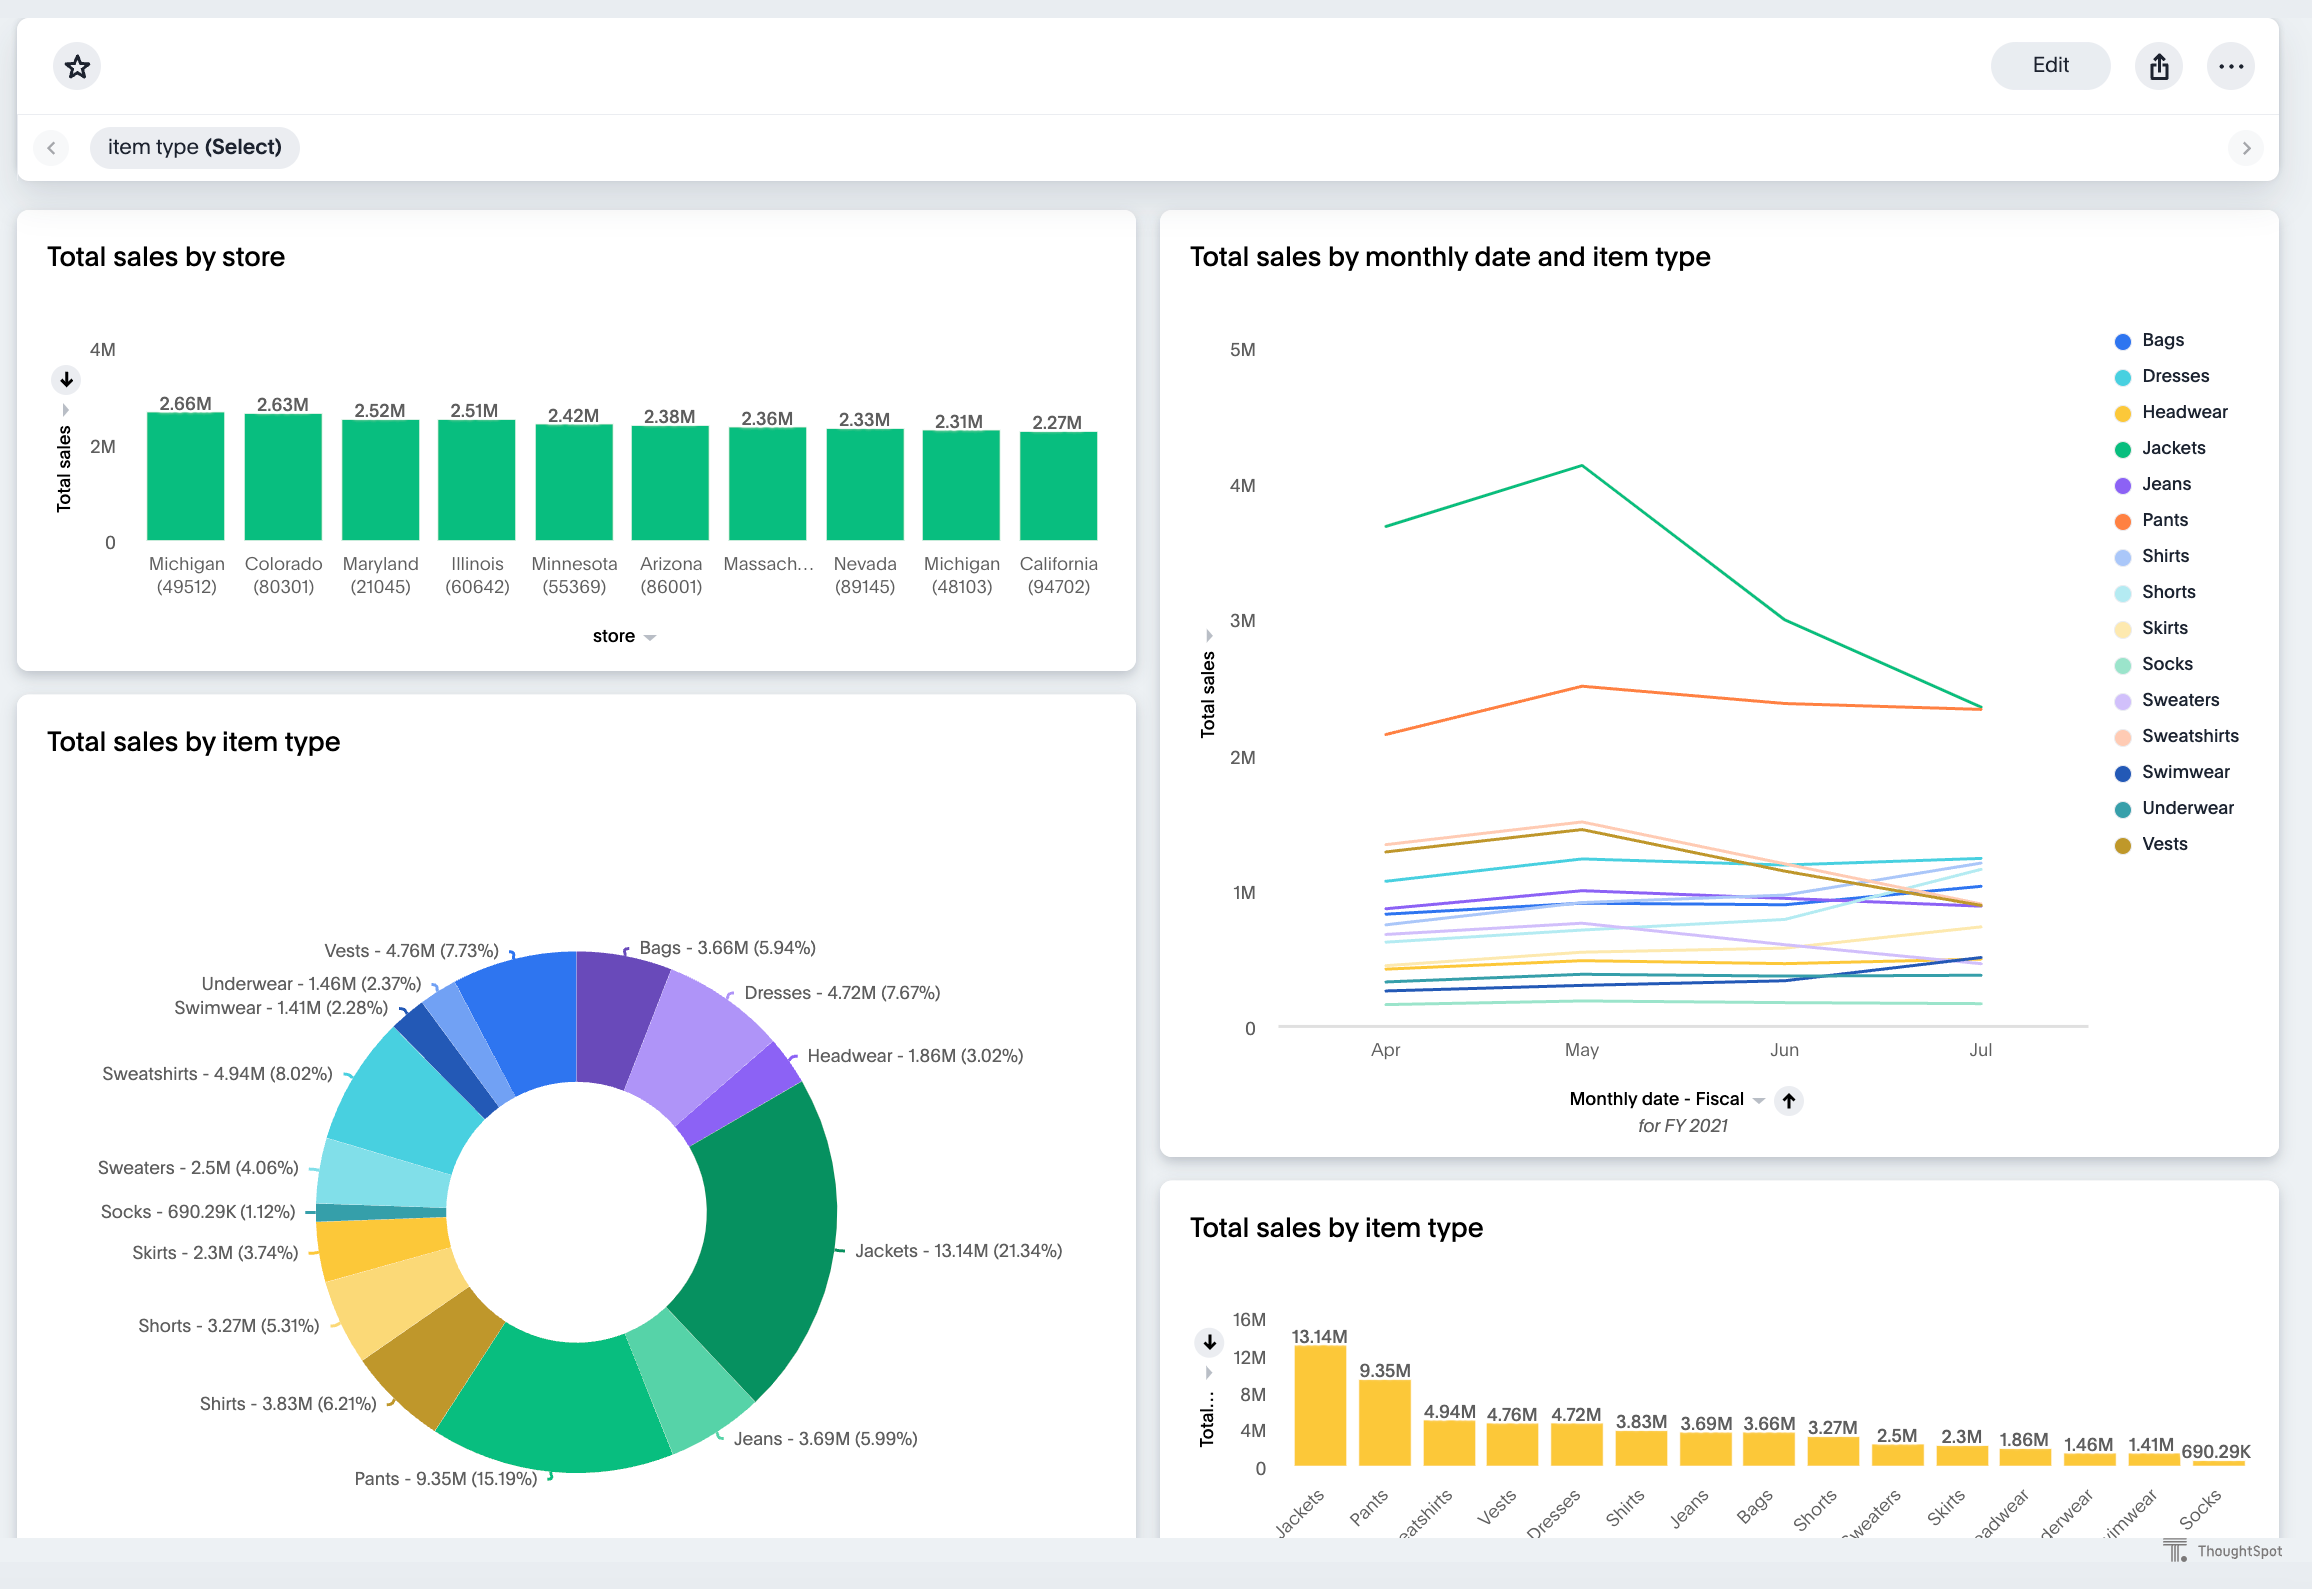
This page explains how to embed a ThoughtSpot Liveboard in your web page, portal, or application.
A ThoughtSpot Liveboard is an interactive dashboard that presents a collection of visualizations pinned by a user.
Import the LiveboardEmbed package🔗
Import the LiveboardEmbed SDK library to your application environment:
npm
ES6
<script type = 'module'>
    import {
        LiveboardEmbed,
        AuthType,
        init,
        prefetch
    }
from 'https://cdn.jsdelivr.net/npm/@thoughtspot/visual-embed-sdk/dist/tsembed.es.js';
Initialize the SDK🔗
Initialize the SDK and define authentication attributes.
Create an instance of the LiveboardEmbed class🔗
const liveboardEmbed = new LiveboardEmbed(document.getElementById('ts-embed'), {
    frameParams: {
        width: '100%',
        height: '100%',
    },
    liveboardId: '<%=liveboardGUID%>',
});
For more information about the Liveboard embed object, classes, methods, interface properties, and enumeration members, see the following pages:
Customize Liveboard view🔗
The LiveboardEmbed component includes the LiveboardViewConfig object. This object provides various attributes and properties to customize the look and feel of the Liveboard page, control the visibility of menu actions and features, and manage interactions between the host and embedded app.
The most common customization is controlling the visibility of menu items in the embedded view by configuring the disabledActions, hiddenActions, and visibleActions properties with an array of Action IDs. For information about the other frequently used properties, see common customization options.
Register, handle, and trigger events🔗
Register event listeners.
liveboardEmbed.on(EmbedEvent.init, showLoader)
liveboardEmbed.on(EmbedEvent.load, hideLoader)
For more information about events, see the following pages:
Render the embedded Liveboard🔗
Render the embedded Liveboard.
liveboardEmbed.render();Verify the embedded object🔗
-
Load the embedded object in your app. If the embedding is successful, you see a Liveboard page with visualizations.
-
Explore the charts and tables, and verify that objects render and show the desired data.
Common customization options🔗
The LiveboardViewConfig object includes several properties and attributes that allow fine-grained control of the embedded experience. You can specify settings that enable or disable a specific feature, control visible or disabled menu elements and actions, set tabs and layout preferences, manage filters, hide the header, and more.
Show/hide large UI elements🔗
Parameters such as hideLiveboardHeader, hideTabPanel, isLiveboardHeaderSticky, showLiveboardTitle, and showLiveboardDescription control various aspects of the standard embedded Liveboard experience. Note the phrasing of the property name and the description in the documentation to understand whether true enables or disables the particular feature.
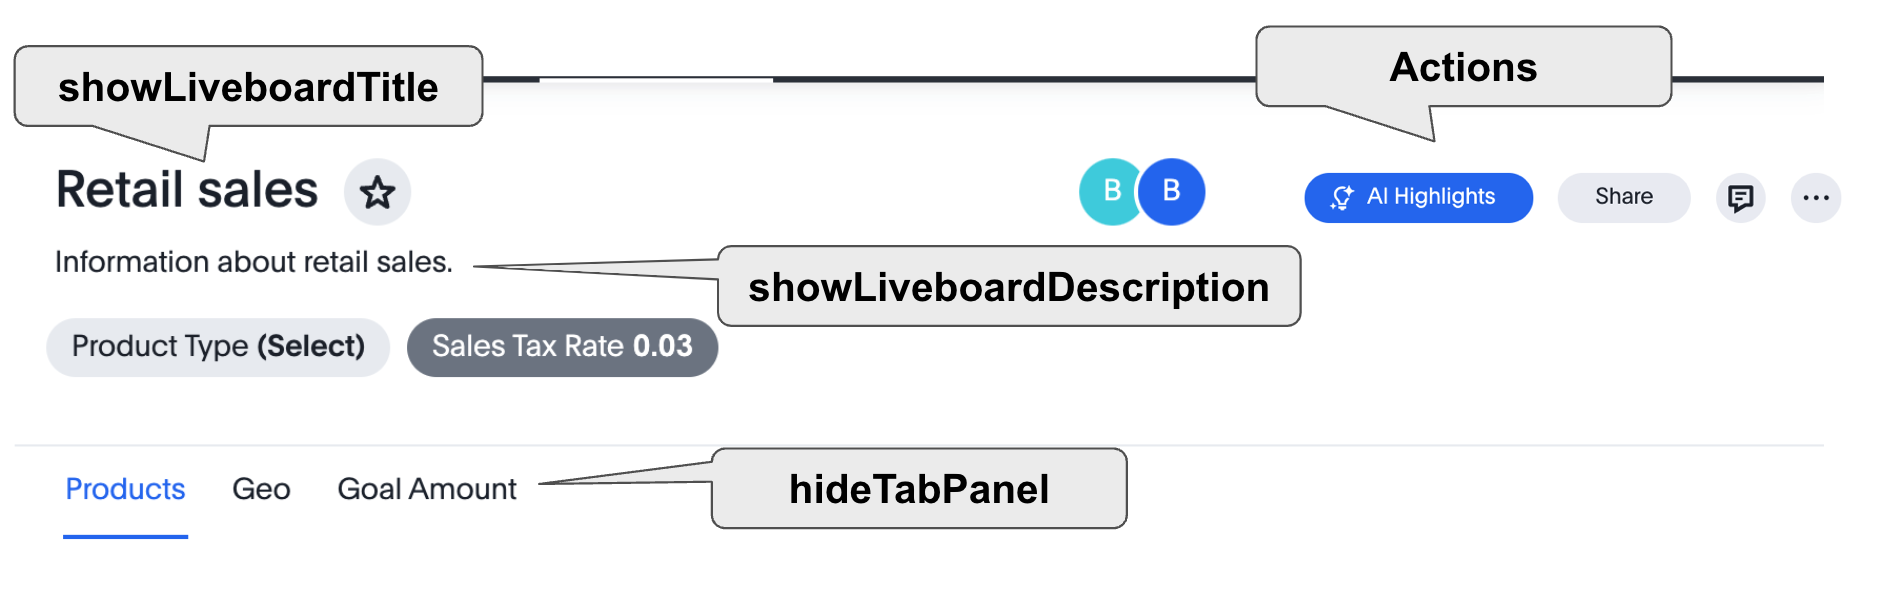
The hideLiveboardHeader property removes the entire header area above the Liveboard, including filters and the overall Liveboard menu, which is a common pattern for "read-only" use cases or for rebuilding your own menus and buttons using HostEvents.
The following constructor disables the sticky header and shows the Liveboard title, which is hidden by default:
const liveboardEmbed = new LiveboardEmbed(document.getElementById('ts-embed'), {
    frameParams: {
        width: '100%',
        height: '100%',
    },
    isLiveboardHeaderSticky : false,
    showLiveboardTitle: true,
    liveboardId: '<%=liveboardGUID%>',
});|
Note
|
When |
Customize Liveboard tabs🔗
By default, the first tab created on a Liveboard is set as the home tab. You can set any tab as an active tab using the activeTabId property in the Visual Embed SDK as shown in the example here:
const liveboardEmbed = new LiveboardEmbed(document.getElementById('ts-embed'), {
    frameParams: {
        width: '100%',
        height: '100%',
    },
    liveboardId: "d7a5a08e-a1f7-4850-aeb7-0764692855b8",
    activeTabId: "05406350-44ce-488e-abc5-5e8cdd65cf3c",
});|
Note
|
The |
Reduce visible tabs and visualizations🔗
visibleVizs and visibleTabs allow you to limit the experience for certain users on a Liveboard with many more elements.
For example, a template Liveboard with many different key performance indicators (KPIs) could be reduced to a smaller set by giving a user an interface to select the particular visualizations to show, storing their selections, and using that saved set of visualization globally unique identifiers (GUIDs) as the array for visibleVizs on page load (there is an equivalent HostEvent called SetVisibleVizs to make an update after the Liveboard has loaded).
Add Note tiles🔗
You can add a Liveboard Note tile with custom text, images, and links on an embedded Liveboard.
-
Only users with edit access to a Liveboard can add a Note tile.
-
Users require
Can upload dataprivilege to upload an image to the note tile. -
If you are adding links and images from an external site, or embedding multimedia or a web page in an iFrame, make sure the URLs are added to CORS and CSP allowlists. For more information, see Security settings.
Redefine Liveboard breakpoint widths🔗
The enable2ColumnLayout property, when enabled, allows you to customize the Liveboard breakpoint width for embedded users.
The current 12 column layout changes to 2 columns per row at 1024px, and to 1 column per row layout at 630px in the new Liveboard experience. Once enabled, these breakpoints apply to all Liveboards in the ThoughtSpot instance, and cannot be set only for individual Liveboards.
These breakpoint widths are customizable for the embedded customers. Contact ThoughtSpot support for assistance with customization.
Liveboard browser cache and refresh🔗
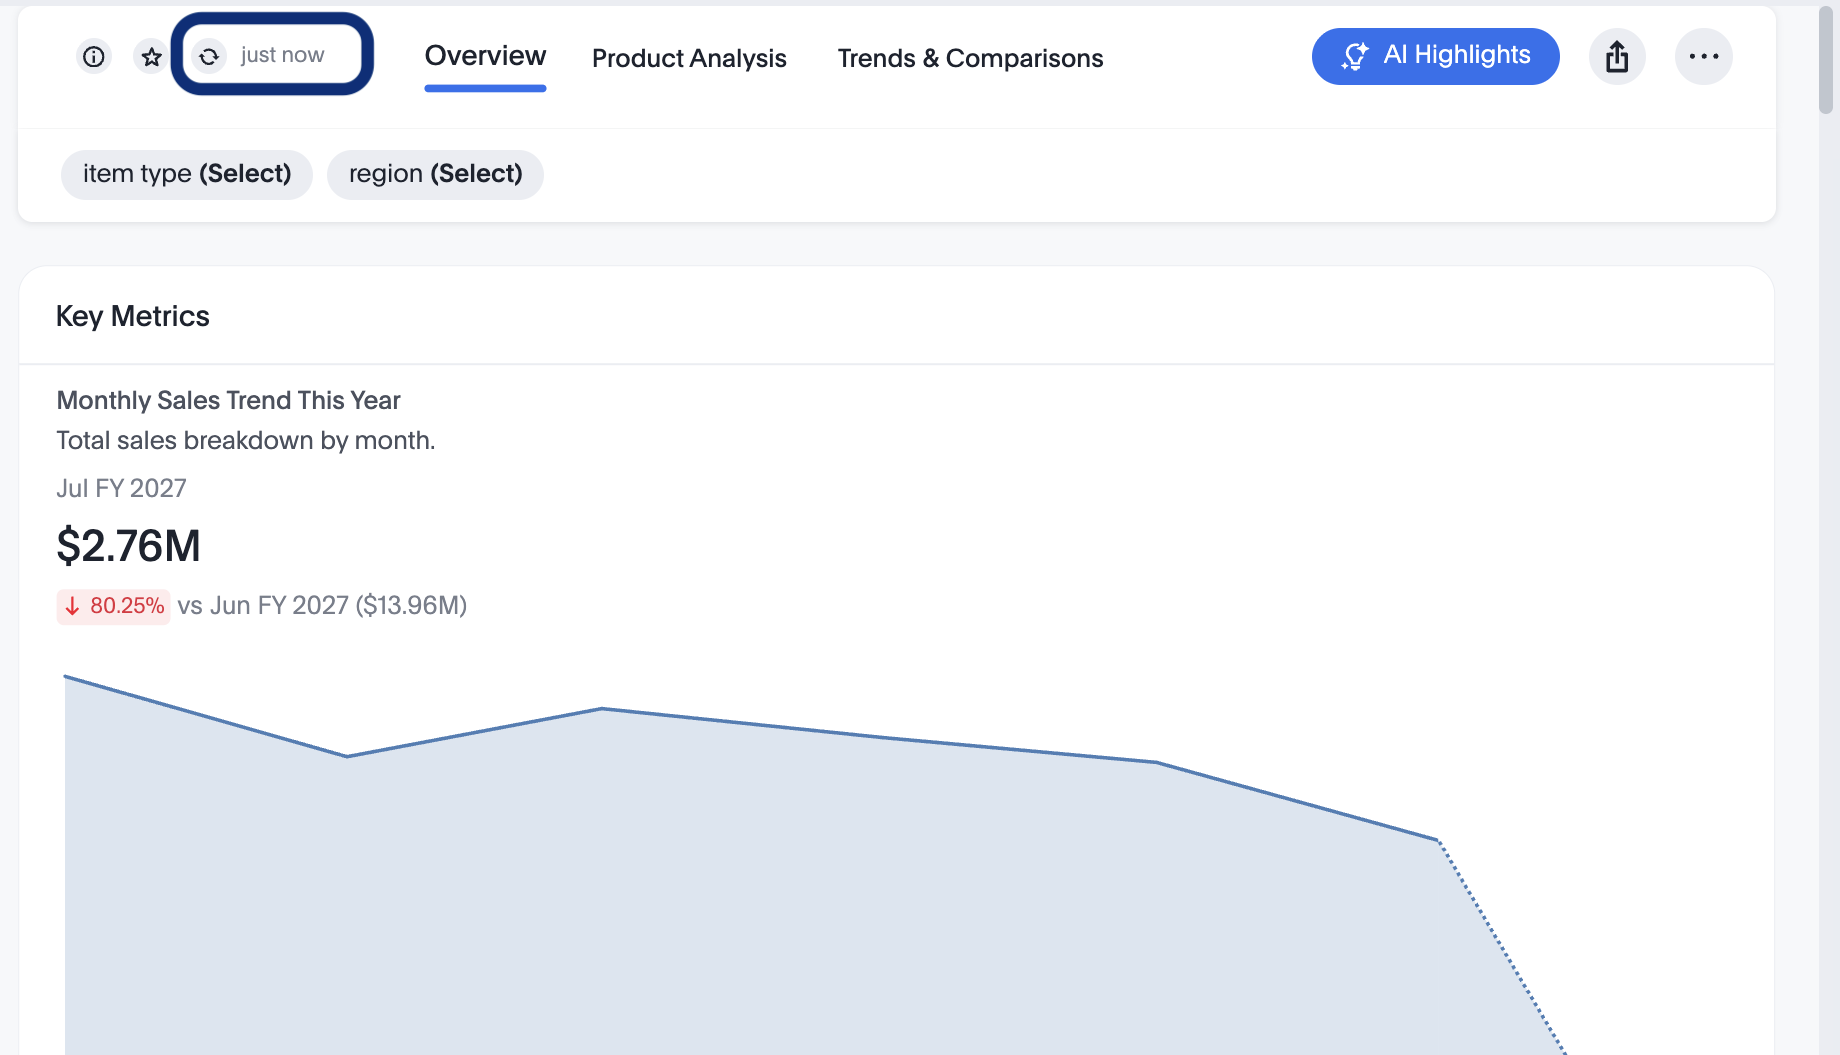
ThoughtSpot supports browser-side data caching for Liveboards to improve load performance for users who revisit the same Liveboard within a session. Users can clear cache by clicking the refresh icon in the Liveboard header.
|
Note
|
Liveboard browser cache and refresh is an Early Access feature and is disabled by default on ThoughtSpot instances. To enable this feature on your instance, contact ThoughtSpot support. |
To enable Liveboard data caching, set enableLiveboardDataCache to true.
const liveboardEmbed = new LiveboardEmbed('#embed-container', {
    frameParams: {
        width: '100%',
        height: '100%',
    },
    liveboardId: '<Your-Liveboard-ID>', //
    enableLiveboardDataCache: true, //
});
When data caching is enabled, the refresh icon appears in the Liveboard header. Users can click this button to clear the browser cache and fetch fresh data.
The Visual Embed SDK also provides the following action IDs and events to customize the cache refresh visibility and workflow.
| ID | Description |
|---|---|
Action ID to show, hide, or disable the Refresh button in the Liveboard header. | |
Emitted when a user clicks the Refresh button in the Liveboard header. | |
Triggers a browser cache refresh programmatically for all visualization containers on the embedded Liveboard. |
Customize filters🔗
To view specific data across the tables and charts on an embedded Liveboard, users can use Liveboard filter options. By default, Liveboard filters cannot be applied at load. You can either embed a Liveboard that already includes filters or use the runtime filters feature in the Visual Embed SDK to apply filters at load time.
|
Important
|
The SDK processes up to 49 runtime filters per embed. Any objects at index 50 or beyond are silently dropped without an error or warning. For more information, see Runtime filter limit. |
Customizing filter visibility🔗
To hide filters in an embedded Liveboard, you can use the following options:
-
Set
hideLiveboardHeadertotrueto hide the entire header area, including filters and the Liveboard menu. You can then trigger filter interactions programmatically using host events.const embed = new LiveboardEmbed('#embed', { ... // other liveboard view config hideLiveboardHeader:true, }); -
If the Liveboard compact header is enabled, set
hideIrrelevantChipsInLiveboardTabstotrueto hide filters that are not relevant to the current tab in an embedded Liveboard.const embed = new LiveboardEmbed('#embed', { ... // other liveboard view config isLiveboardCompactHeaderEnabled: true, hideIrrelevantChipsInLiveboardTabs: true, });
Updating filters🔗
Use the following host events in the Visual Embed SDK to update filters:
-
HostEvent.UpdateFiltersto update Liveboard filters -
HostEvent.UpdateRuntimeFiltersto update runtime filters
For more information and examples, see Filter types and application layers.
Liveboard download options🔗
Embedding application users can download Liveboards in the PDF, XLSX, and CSV formats. If the isContinuousLiveboardPDFEnabled is set to true, users can download the PDF with a continuous layout as seen in the UI, with each tab on a single page. When this parameter is set to false, users can download the Liveboard PDF in the A4 format with a paginated view.
|
Note
|
Starting with ThoughtSpot Cloud version 26.5.0.cl and Visual Embed SDK version 1.48.x, the new multi-format download experience is available on embedded Liveboards and can be enabled using the |
XLSX and CSV in Liveboard scheduled exports🔗
To enable Liveboard scheduled exports in XLSX and CSV format from the embed view, ensure that isGranularXLSXCSVSchedulesEnabled is set to true.
const embed = new LiveboardEmbed('#tsEmbed', {
    //...
    isGranularXLSXCSVSchedulesEnabled: true, // enable scope selection for XLSX and CSV Liveboard scheduled jobs.
});
Download actions and behavior🔗
| Download actions | SDK parameter | Action ID for show/hide control |
|---|---|---|
Download menu action | Enabled by default. | Use the |
Continuous PDF |
| Use the |
XLSX download |
|
|
CSV download |
|
|
PDF cover and filter pages | None. UI options in PDF modal only. | Use |
Example🔗
The following example enables the PDF (Continuous), XLSX, and CSV options in the Liveboard Download modal.
const embed = new LiveboardEmbed('#tsEmbed', {
  isContinuousLiveboardPDFEnabled: true,
  isLiveboardXLSXCSVDownloadEnabled: true,
});
To hide or disable the download options, specify the following action IDs:
const embed = new LiveboardEmbed('#tsEmbed', {
  //...
  hiddenActions: [
    Action.DownloadLiveboard, // Hides the Download parent action from the more options menu
    Action.DownloadLiveboardAsContinuousPDF, // Hides the Continuous PDF download option from the Download modal
    Action.DownloadLiveboardAsCsv, // Hides the CSV download option from the Download modal
    Action.DownloadLiveboardAsXlsx // Hides the XLSX download option from the Download modal
  ],
  // Use either `hiddenActions` or visibleActions, not both, to avoid errors
  //visibleActions: [
    //Action.DownloadLiveboard, // Shows the Download parent action in the more options menu
    //Action.DownloadLiveboardAsContinuousPDF, // Shows the Continuous PDF download option
    //Action.DownloadLiveboardAsCsv, // Shows the CSV download option
    //Action.DownloadLiveboardAsXlsx // Shows the XLSX download option
  //]
});
const embed = new LiveboardEmbed('#tsEmbed', {
//...
disabledActions: [
Action.DownloadLiveboard,// Disables the Download parent action in the more options menu
Action.DownloadLiveboardAsContinuousPDF, // Disables the Continuous PDF download option in the Download modal
Action.DownloadLiveboardAsCsv, // Disables the CSV download option in the Download modal
Action.DownloadLiveboardAsXlsx, // Disables the XLSX download option in the Download modal
],
});HostEvent workflow for the download actions🔗
Use the HostEvent IDs to trigger download actions on an embedded Liveboard.
-
HostEvent.DownloadLiveboardAsContinuousPDF
To open the Download modal with the continuous PDF download option selected. -
HostEvent.DownloadAsPdf
To trigger the standard PDF (A4) download action. To download a specific Liveboard visualization, specify the GUID of the visualization in thevizIdkey. -
HostEvent.DownloadAsXlsx
To open the Download modal with the XLSX option selected when theisLiveboardXLSXCSVDownloadEnabledis enabled in the embed view. -
HostEvent.DownloadAsCsv
To open the Download modal with the CSV option selected whenisLiveboardXLSXCSVDownloadEnabledparameter is enabled in the embed view.
Liveboard grouping and styling🔗
Early Access
You can now create a visual group of Answers and note tiles together in the Liveboard. You can select multiple Answers and notes in the Liveboard editor. You can also style parts of the Liveboard, groups and Answers with the new styling panel.
To enable this feature, set isLiveboardMasterpiecesEnabled to true.
Note the following changes that occur in the Liveboard UI and layout when this feature is enabled.
-
All tiles on the Liveboard now have a default border and an increased border-radius, resulting in more pronounced curved corners. This is part of the broader visualization tile customization options to enhance the visual appearance of charts and tables.
-
For Note tiles, the default scrollbar is now hidden for long content. Users must scroll within the tile area itself, and if the tile is not sized appropriately for its content, it may appear clipped due to the new container styles. This change emphasizes the importance of sizing Note tiles correctly to avoid content being visually cut off.
-
If a Liveboard is saved with Groups in the ThoughtSpot interface, but the embedding code does not have the grouping and styling feature enabled, the Liveboard fails to load and returns an error.

To embed a Liveboard that uses Groups, you must set
isLiveboardMasterpiecesEnabledtotruein your embedding configuration. This is required for compatibility with the new grouping and styling features; otherwise, the embedded Liveboard does not render correctly.
For more information, see Liveboard grouping and styling.
For information about the CSS variables for this feature, see CSS variables reference.
Additional resources🔗
-
For information about runtime overrides, see Runtime filters and Runtime Parameter overrides.
-
For code examples, see Developer examples.
-
For more information about the SDK APIs and attributes, see Visual Embed SDK Reference Guide.