Embed Analytics with ThoughtSpot & Databricks
1. Overview
Duration: 0:02:00
Central to the success of the modern data stack is the ability to derive insights from data to make better, more informed business decisions. This tutorial will teach you how to use two critical parts of the modern data stack: ThoughtSpot Everywhere, a suite of developer tools and sdks designed for developers to embed and share insights from ThoughtSpot, and the Databricks Lakehouse platform which unifies the best of data warehouses and data lakes into one simple platform to handle data storage, analytics and AI use cases. You will create a number of visualizations in ThoughtSpot, based on data from Databricks, and embed them into a web app.
2. Getting Started
Duration: 0:10:00
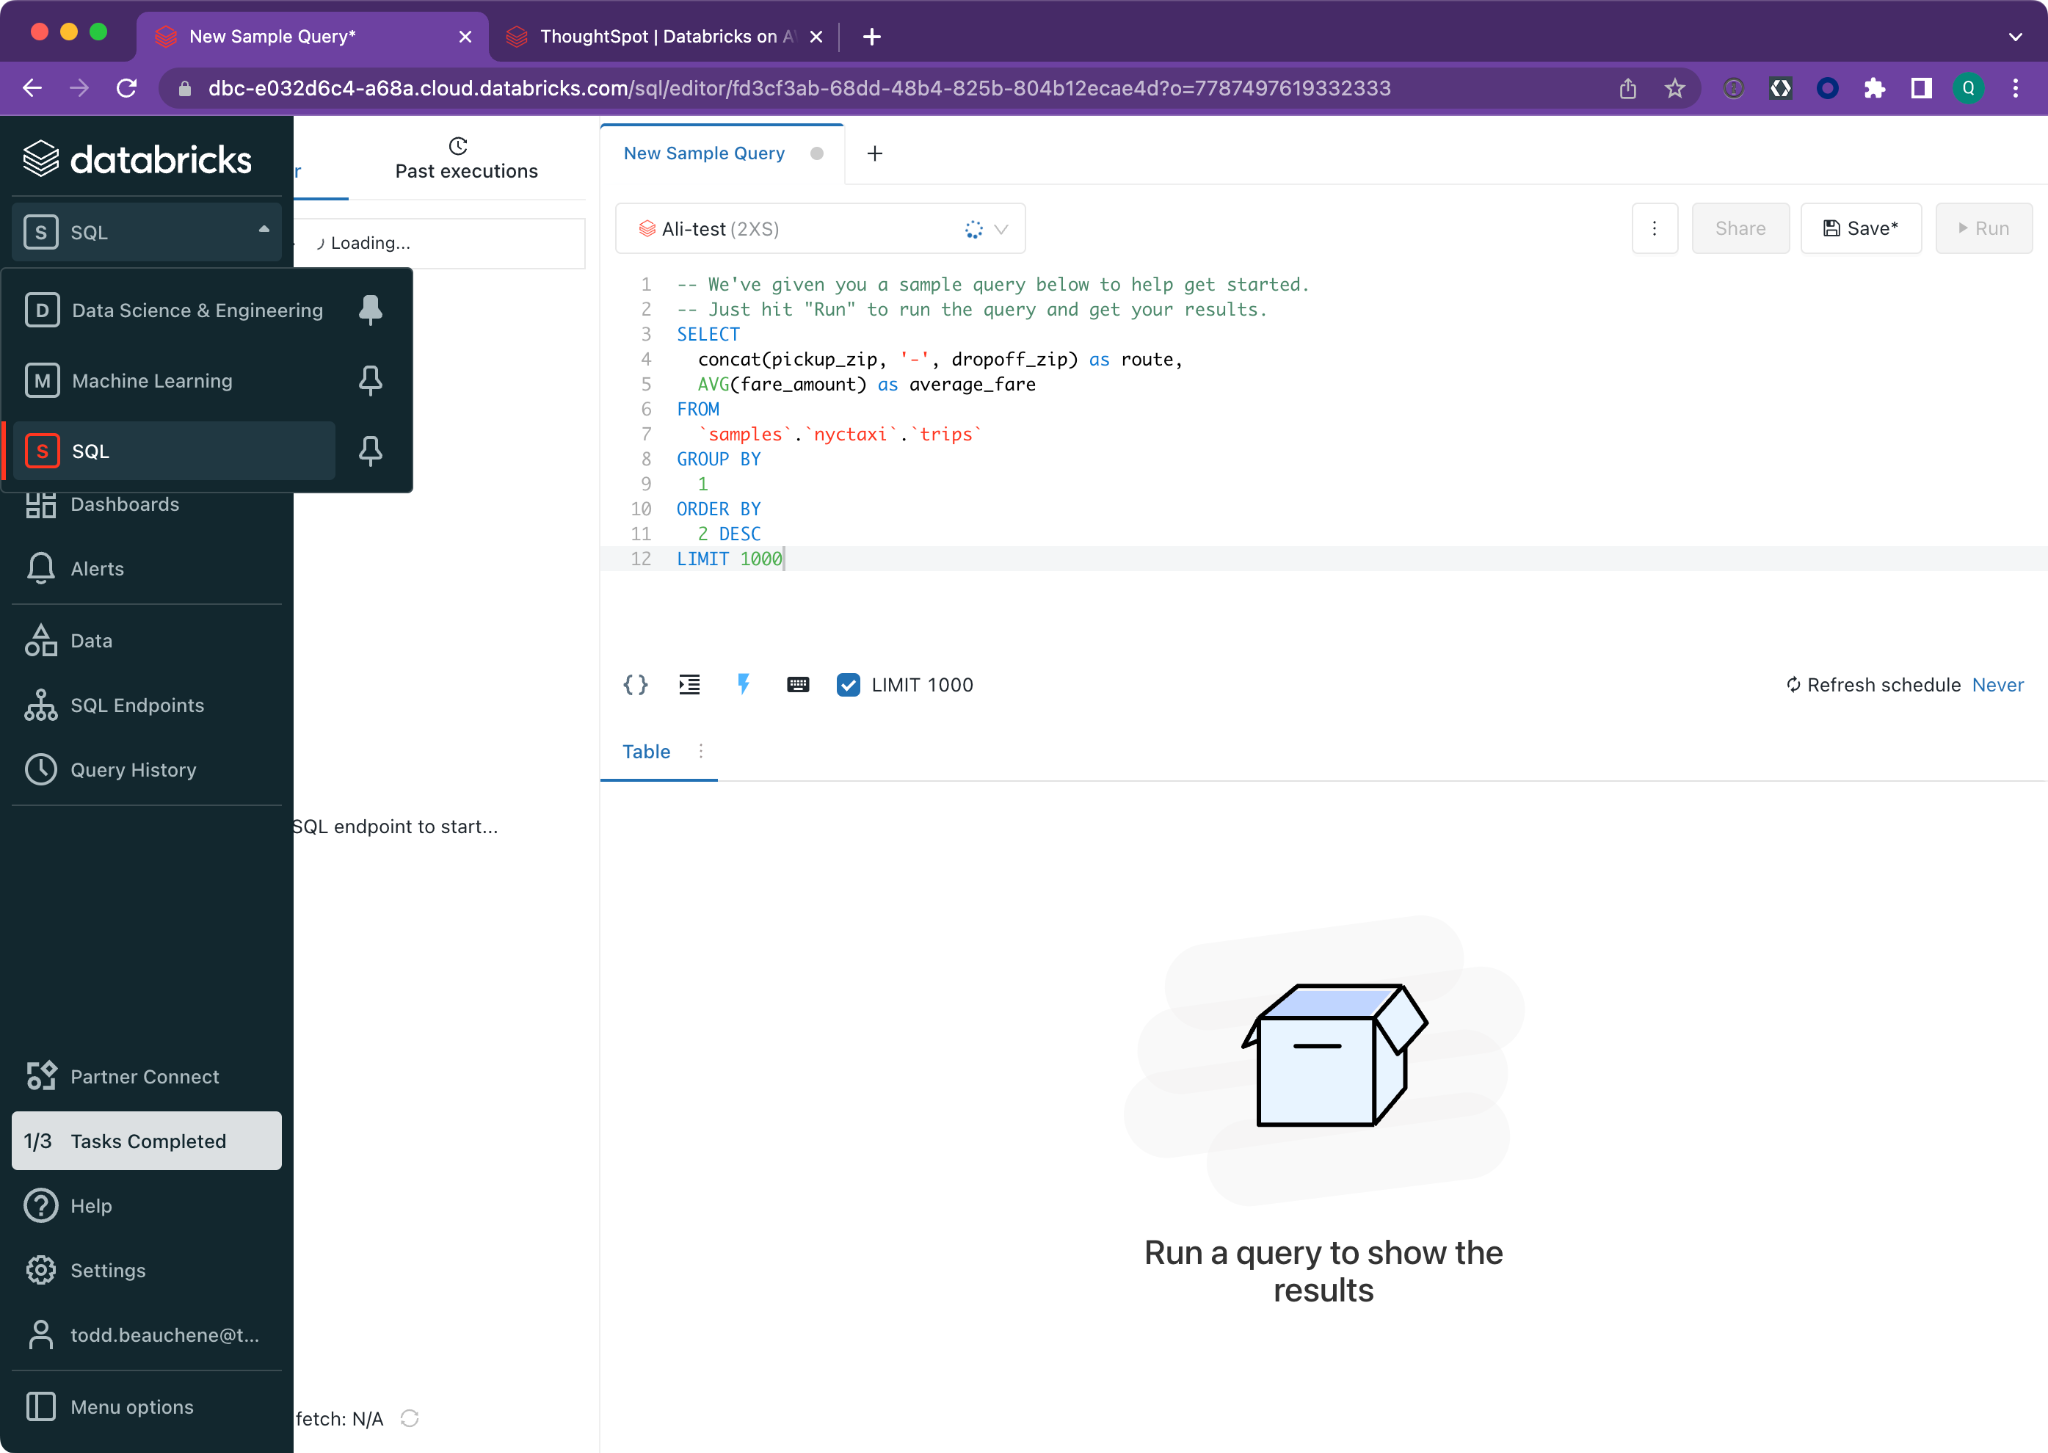
You can either use an existing Databricks account, or create a new one. Once you have successfully logged into Databricks, you will want to switch to the SQL Workspace via the left hand navigation.
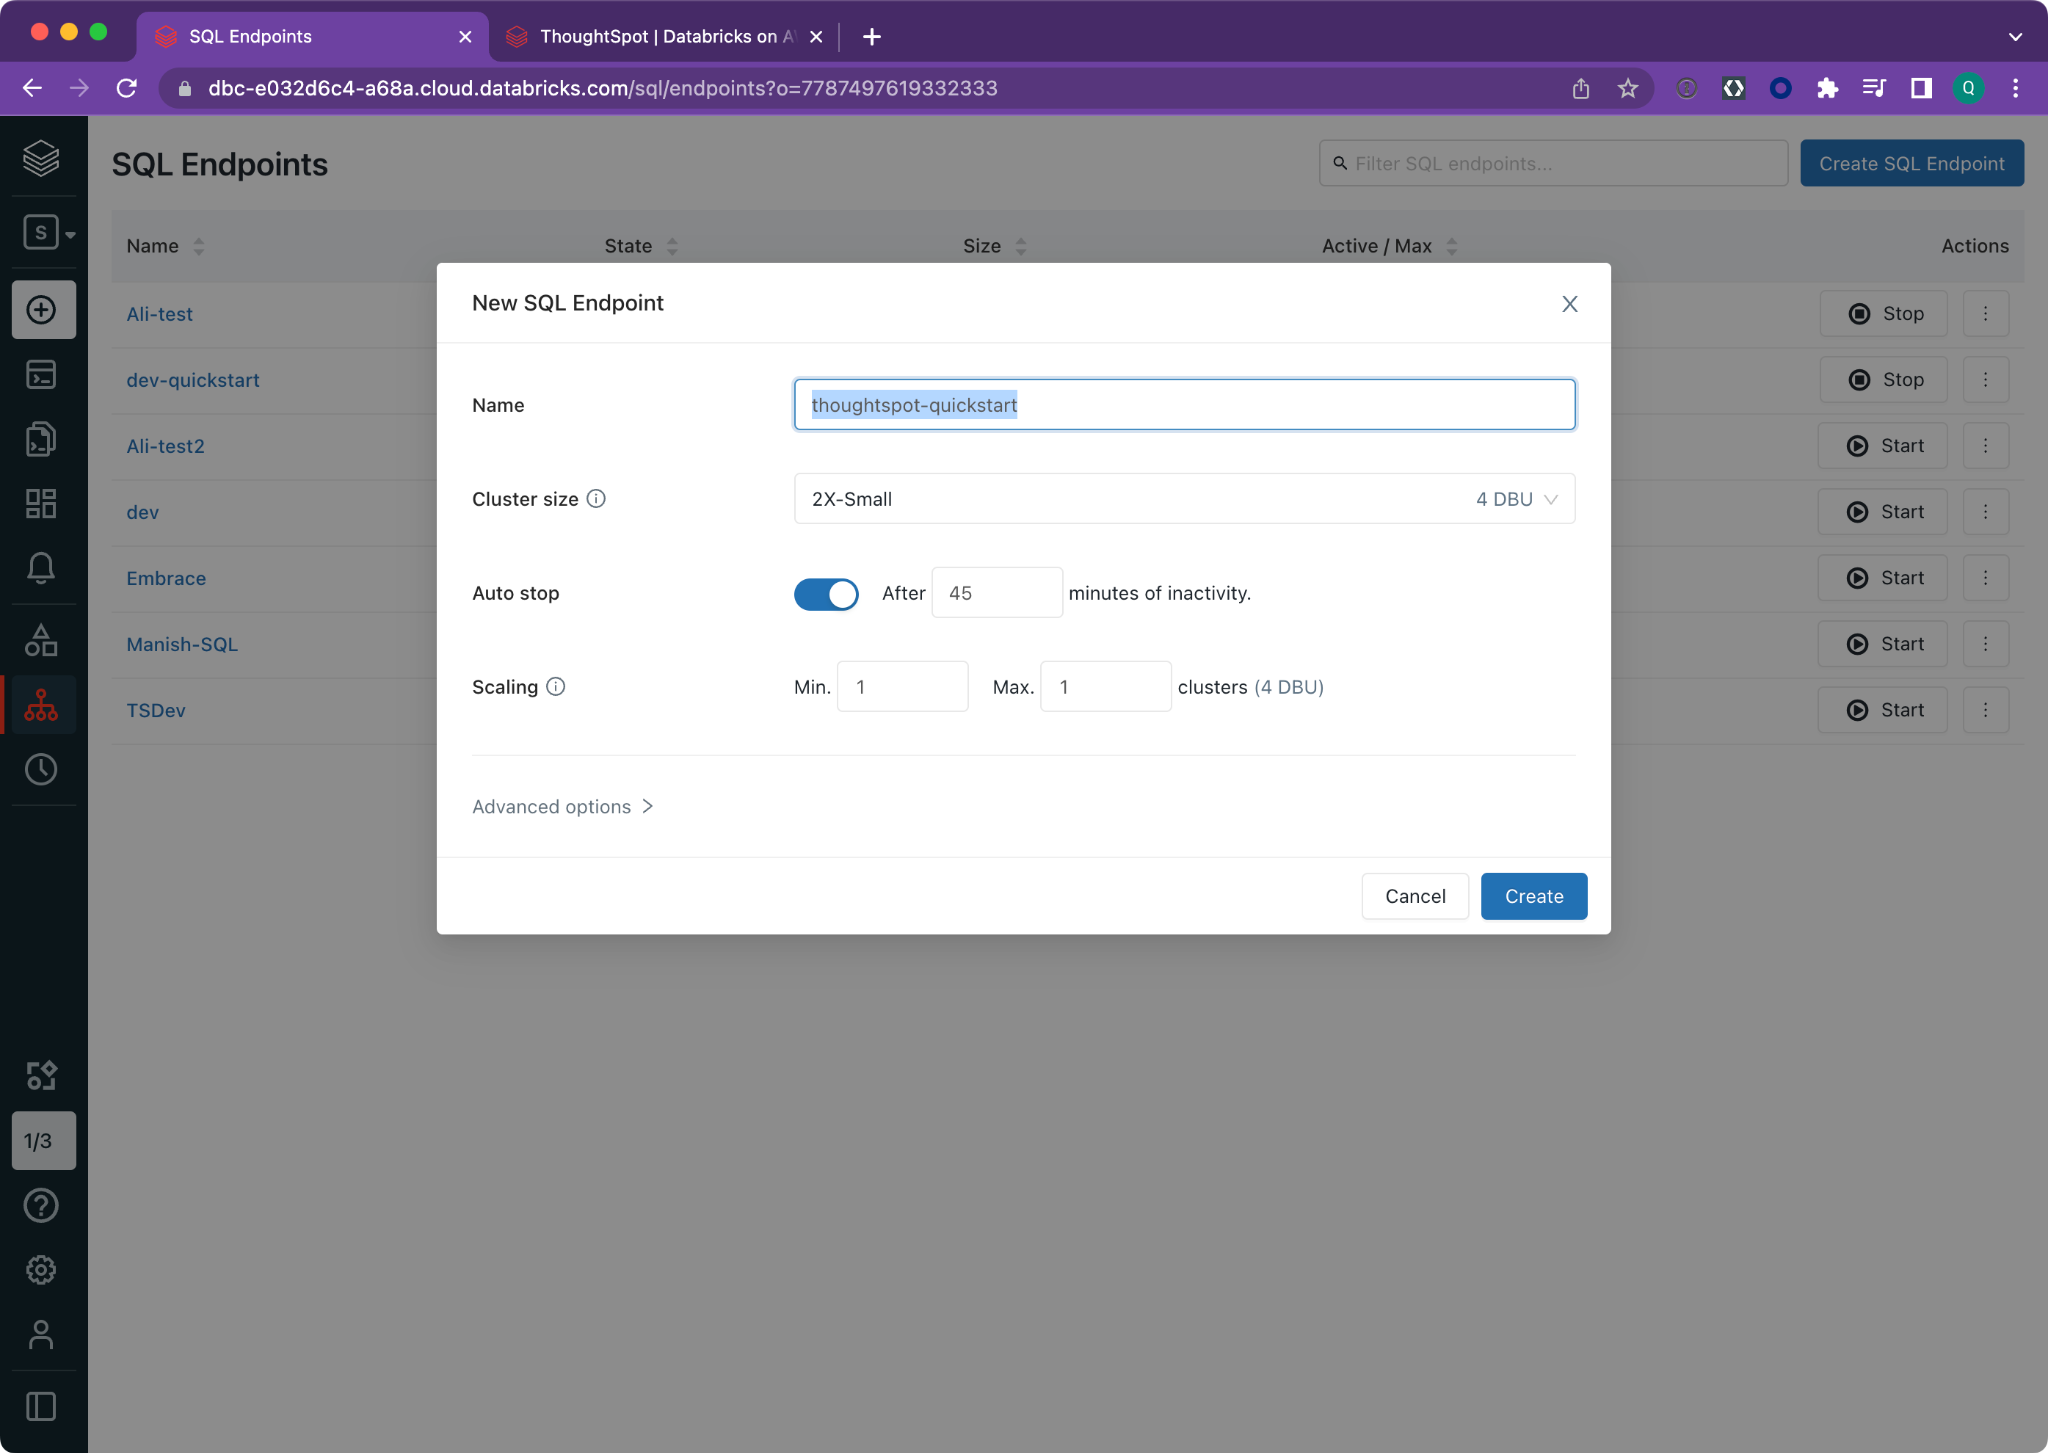
Next, create a new SQL endpoint. This endpoint will be used to create the connection with ThoughtSpot. It is good practice to create a new endpoint per connected system to ease maintenance and provide better security controls.
From the menu, select SQL endpoints, then create a new endpoint called thought-quickstart. The endpoint will automatically start up, but can take some time. If you already have coffee brewing, now’s a good time to pour yourself a cup.
3. Create a ThoughtSpot Connection
Duration: 0:10:00
Once your SQL endpoint has started, let’s create a connection to ThoughtSpot using the new Partner Connect wizard. This wizard will automatically create a new ThoughtSpot free trial instance and connect it to Databricks for you.
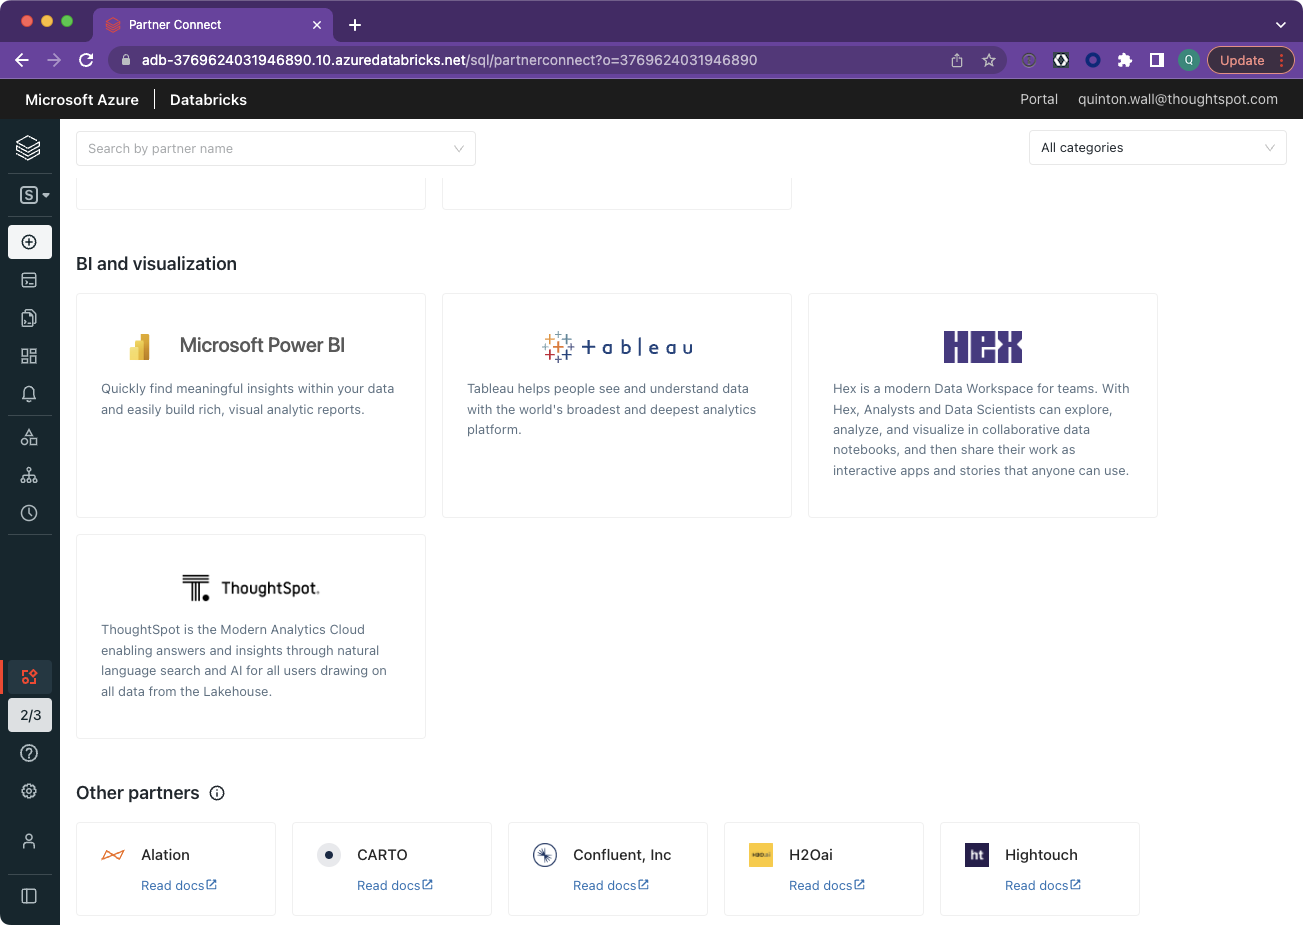
From the left hand navigation, select Partner Connect, then scroll down to the BI and Visualization section. Select the ThoughtSpot tile to start the connect wizard.
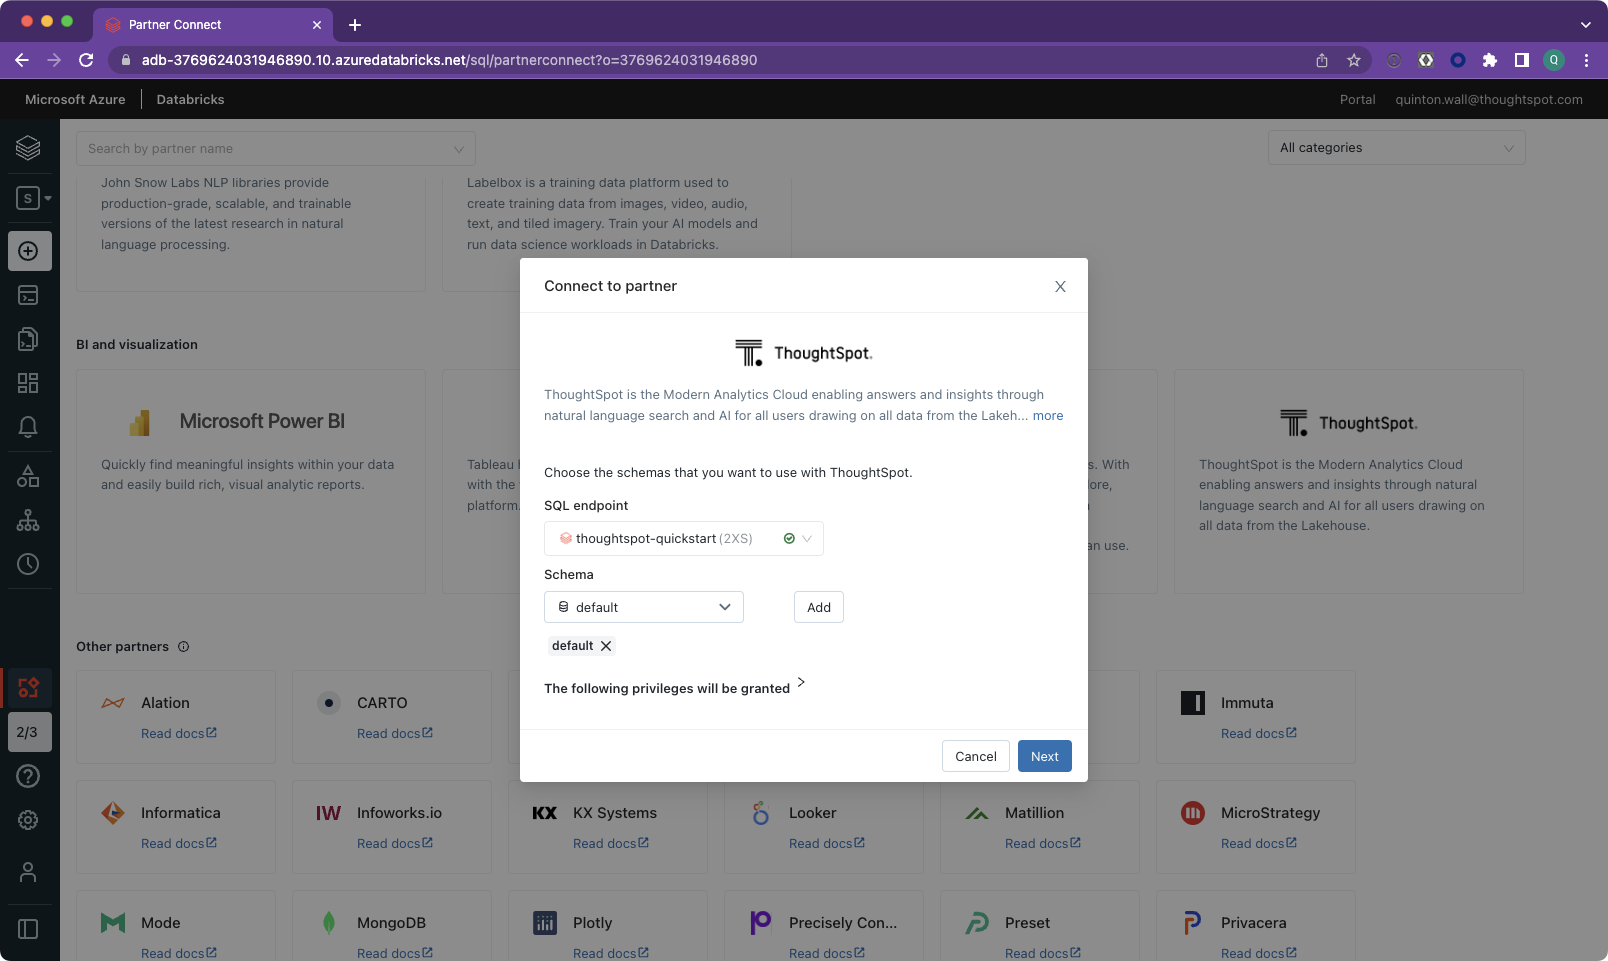
Select the thoughtspot-quickstart endpoint and default schema. Tap Add, then Next, following the wizard steps and accepting the defaults.
In the final screen, you will see the email which is associated with your Databricks account. This will be used as your username to access ThoughtSpot. You can not change this. If you already have a ThoughtSpot instance associated with this name, it is recommended that you create a new Databricks trial account, or log into Databricks as a different user.
Tapping next will redirect you to ThoughtSpot to complete the process, and log you into ThoughtSpot. You should now see the homepage of your ThoughtSpot free trial account.
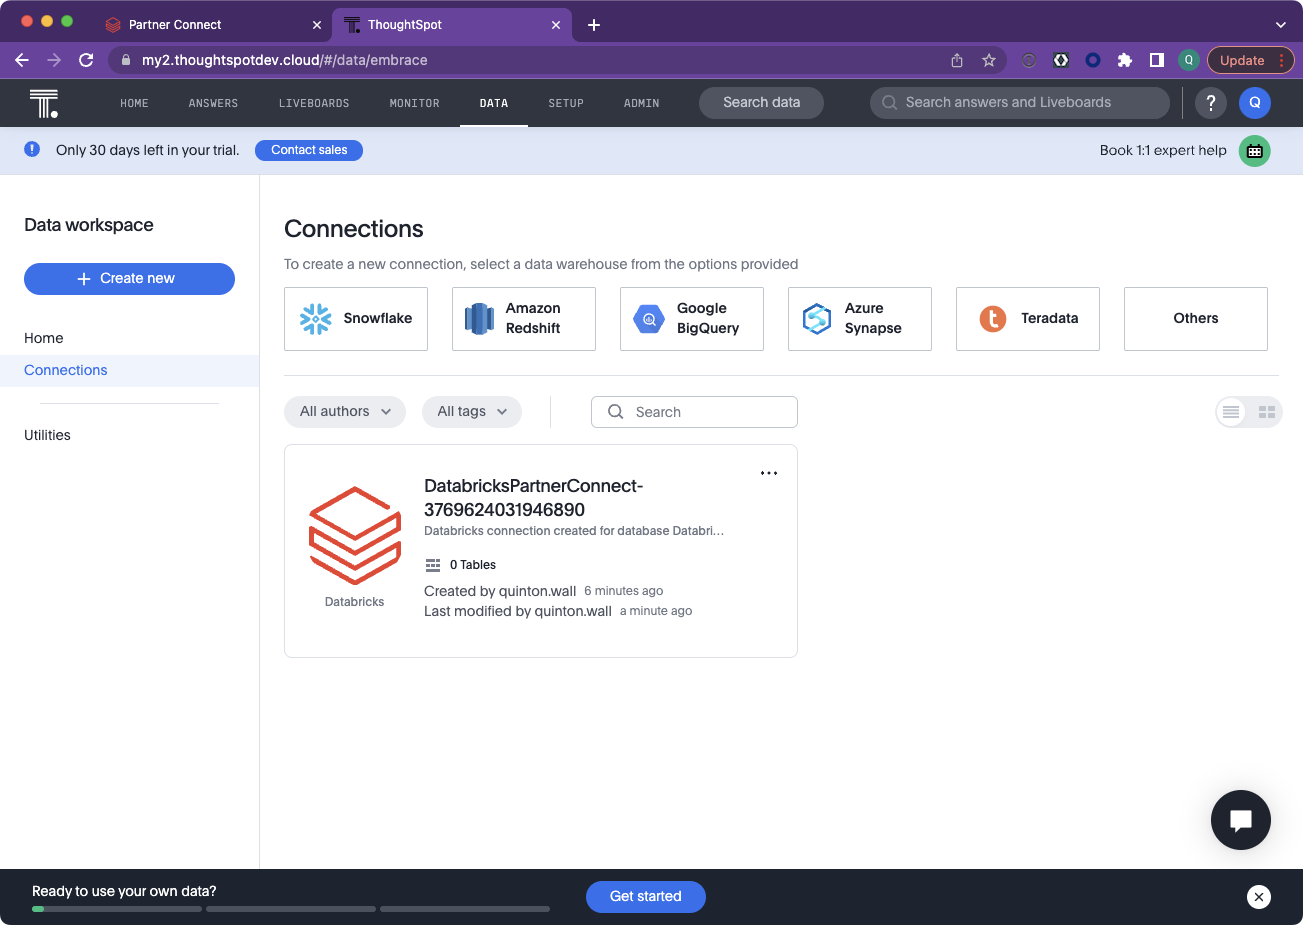
To confirm that everything has been created successfully, tap Data from the top navigation, then Connections. You should see a large title like below.
4. Map table
Duration: 0:10:00
With the connection to Databricks created, it is time to tell ThoughtSpot which tables you want to sync. We are going to take advantage of the NYC table sample data which ships with Databricks. All we need to do is map the appropriate table and fields.
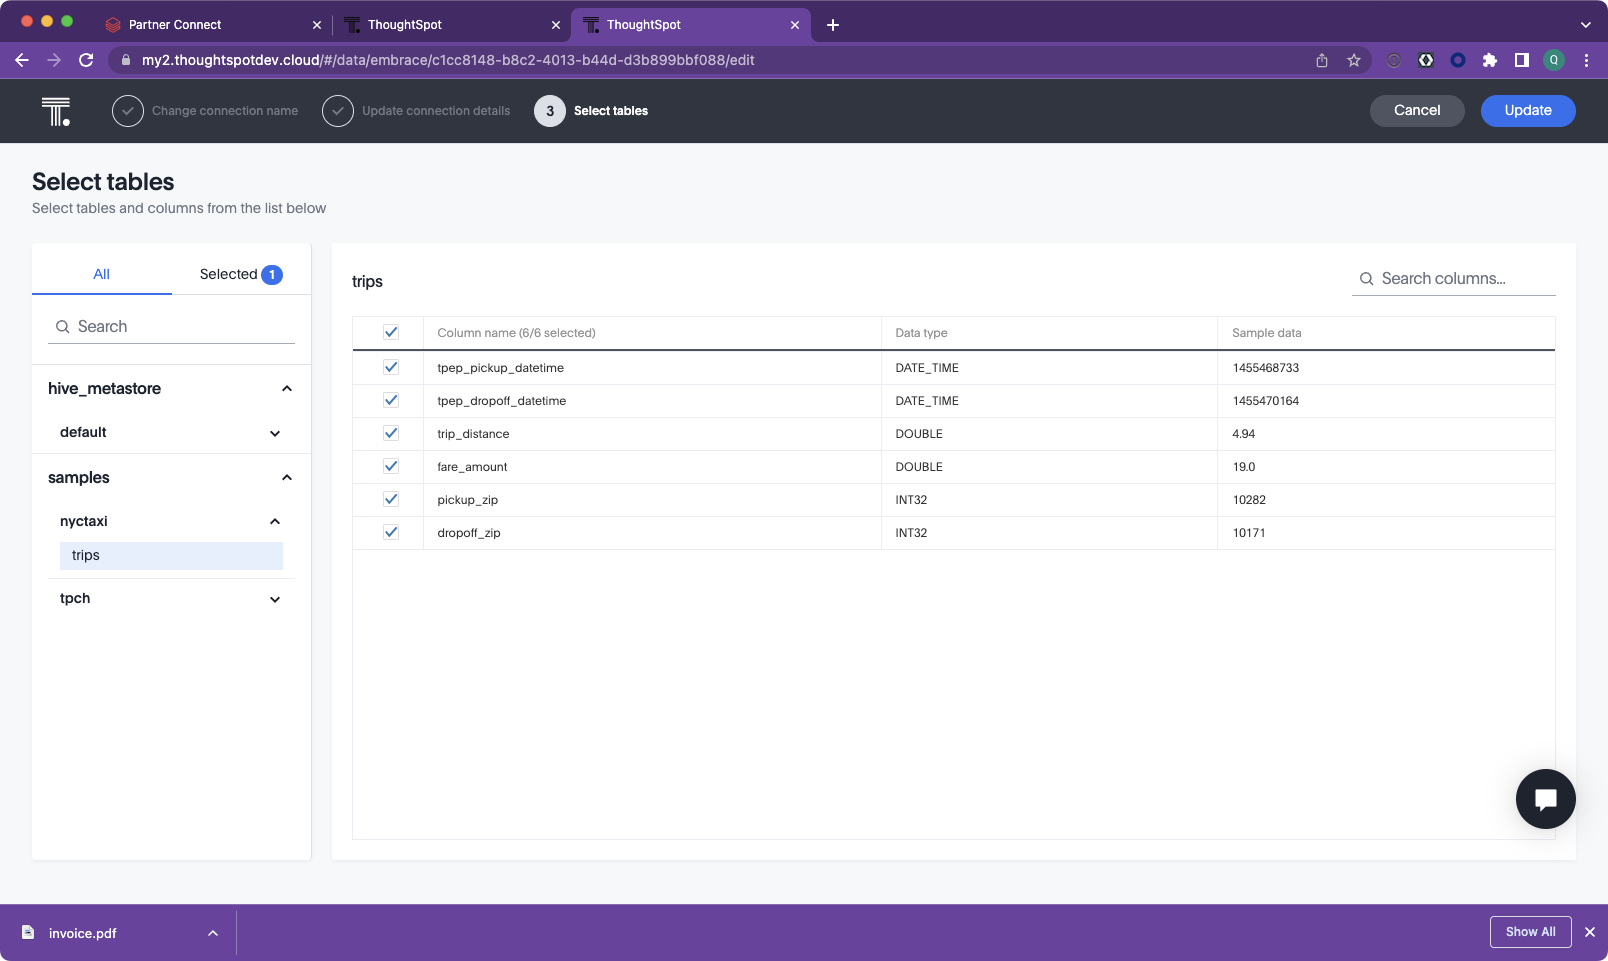
Tap the Databricks tile, then Edit Connection. On the left, expand the samples catalog, and select the nyctaxi schema. Then, select the trips table and check all columns. Finally, tap update to complete the process.
Set Column types
Once the table is created, you may have noticed that the pickup and drop-off zip fields are set to INT32. ThoughtSpot supports geo fields to make it easier to visualize data on maps. Although the sample dataset is limited to New York state, it’s still a good practice to mark these fields as geo compatible. To do so, tap the table name, then scroll to the right and set the Geo field to Sub-nation Region > Zipcode for both pickup_zip and dropoff_zip.
While you are editing fields, we also want to set the zip files and fare_amount to have a Column Type of ATTRIBUTE. By default, connected tables are set to aggregate information to improve performance. Setting the column type to ATTRIBUTE provides more flexibility on searching data vs. just showing a summary or aggregate information.
5. Create and save Answers
Duration: 0:15:00
Now that we have the data synced and fields configured, it is time to take advantage of the powerful search capabilities in ThoughtSpot. Admittedly, the data set we are working with is pretty simple – we won’t be doing any incredibly complex analytics, but it is a great introduction to what is possible. For this tutorial, we want to answer two questions:
- What were the weekly fares collected?
- Which zip codes have the highest fare prices?
To answer these questions, tap on the Search data field in the top navigation.
Weekly Fares
In the search bar, enter the following term, then hit enter:
tpep_pickup_datetime weekly sum fare amount
As you type, you will see your natural language terms change into search tokens. The ThoughtSpot platform translates these tokens into optimized queries to get the answer you are looking for.
As soon as you hit enter, you will see the results rendered in a line graph. Go ahead and change it to a column graph by tapping the Change visualization icon on the right.
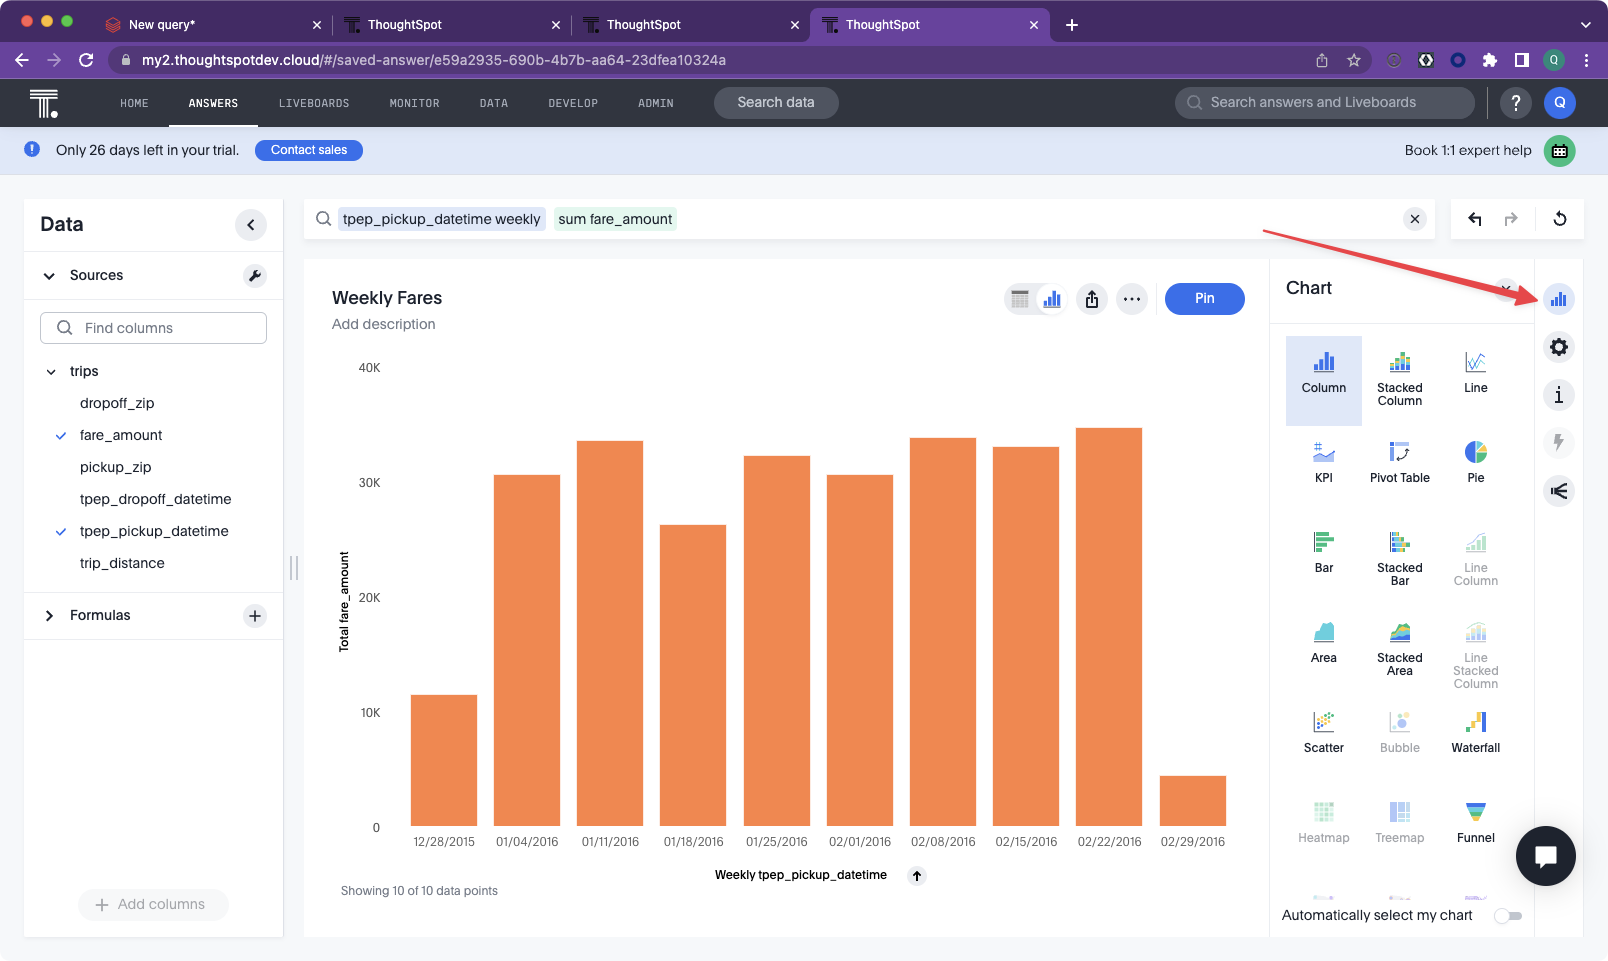
Things are looking good. We’ve answered our first question. Tap the ellipsis button and select Save. Give it a name of “Weekly Fares”
ZIP codes with the highest fares
Next, we want to know which ZIP codes have the highest fares. From the top navigation, select Search data again. This time, enter the following term:
Fare_amount pickup_zip top 10
Once you hit enter, the results may automatically render with a map visualization. This is because we specified the ZIP code fields as being of type Geo. However, this doesn’t help us much because the sample data is based on taxis in the NYC area; In other words, everything is in the same state, New York.
Let’s go ahead and change the chart type to Pie chart by tapping the Change Visualization button again. Once changed, tap the Edit Chart Configuration button directly below Change Visualization. Then, tap Settings and check Display all labels.
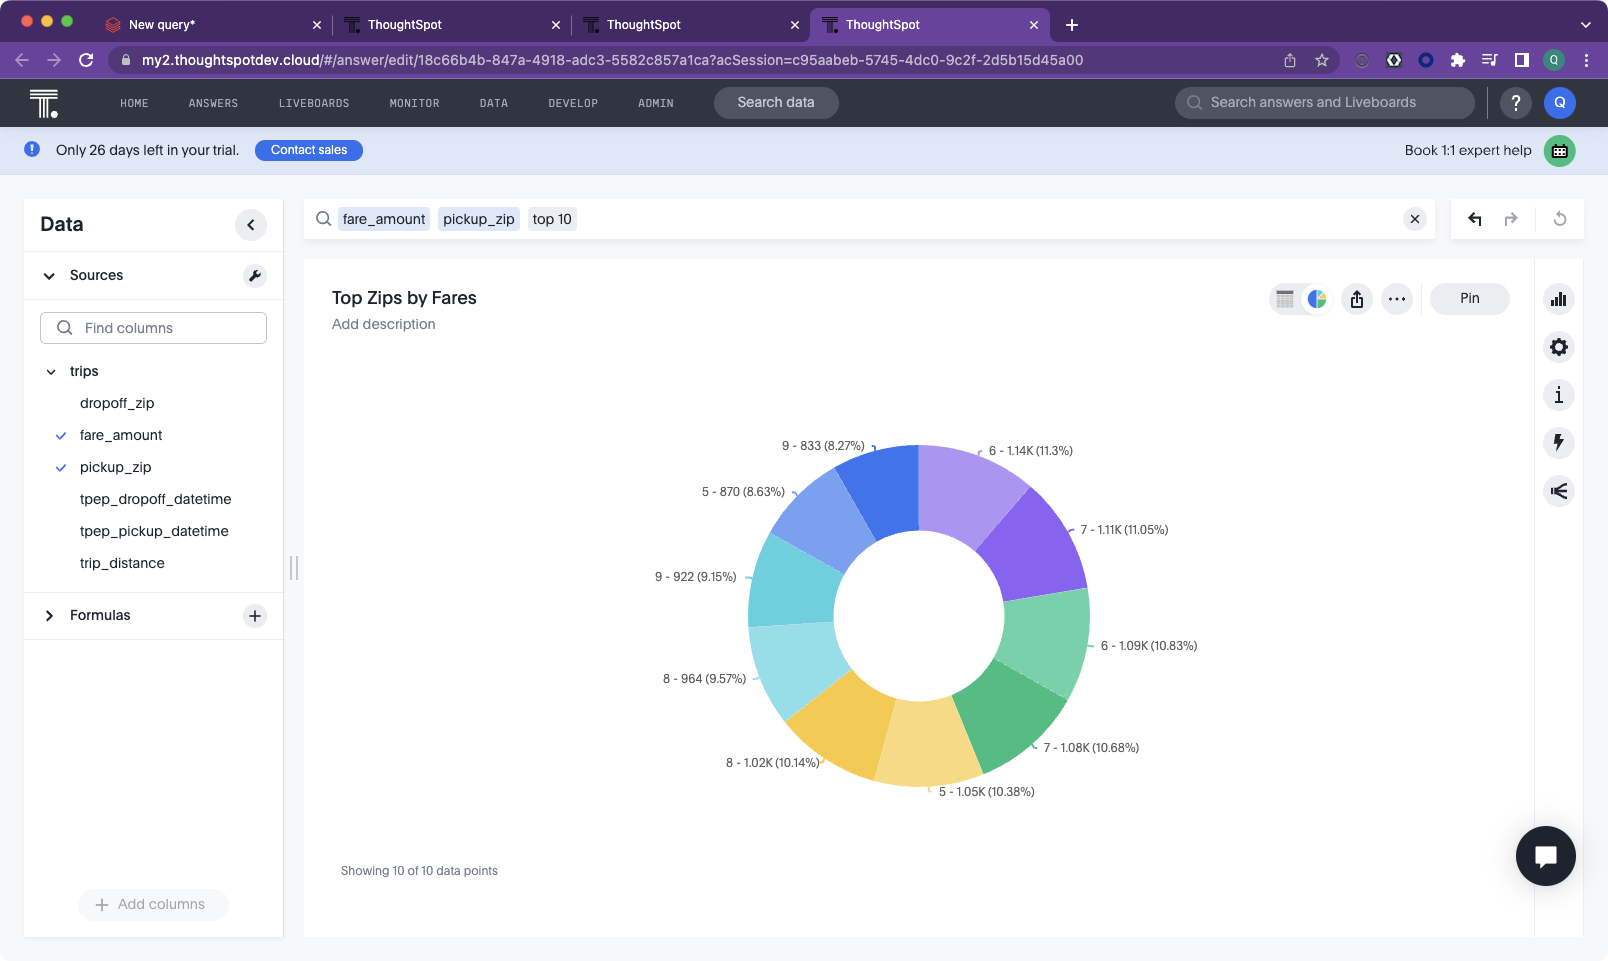
Once your visualization looks similar to the image above, tap the ellipsis button and save it with the name “Top zips by fares”.
Congratulations, you’ve successfully answered your two questions using ThoughtSpot. Nice work.
6. Create a Liveboard
Duration: 0:05:00
To make it easy for users to view all of the answers we’ve uncovered for Taxis, let’s combine them into a single Liveboard. You can think of a Liveboard as being similar to a traditional dashboard. Unlike dashboards, which provide a static picture of data, Liveboards allow users to drill down into the answer provided to perform further analysis as they have more questions.
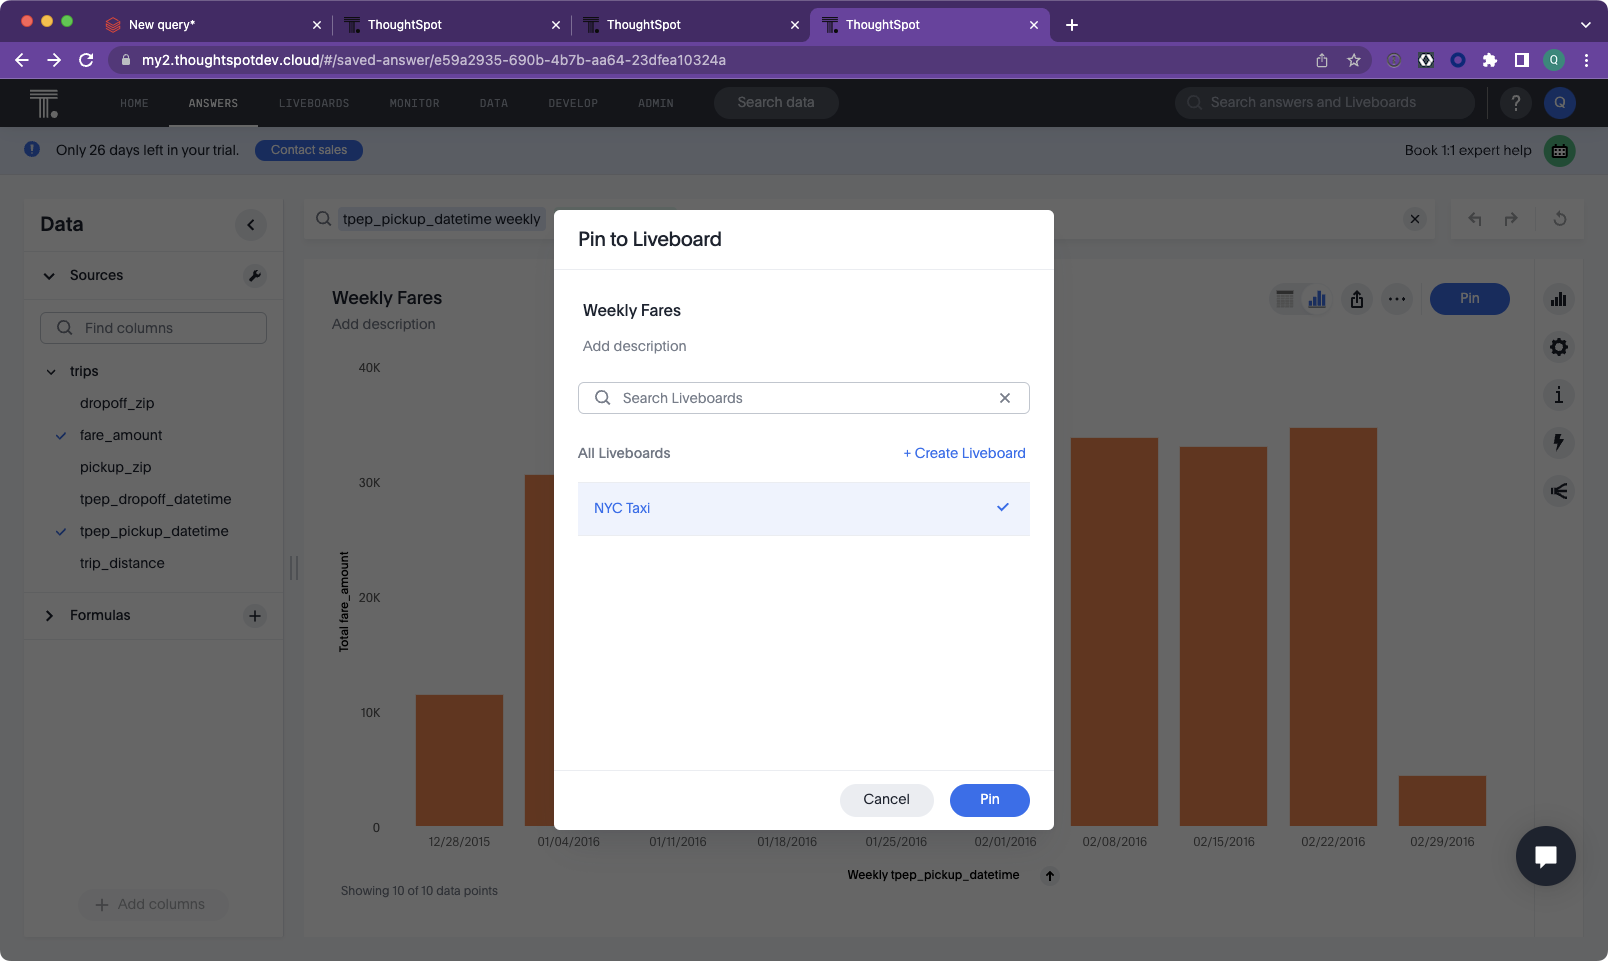
With ThoughtSpot, tap Liveboards from the top navigation. Then, tap Create a Liveboard, and call it “NYC Taxi”. Once saved, select Answers from the top navigation, and tap into each of the Answers you saved previously: Weekly dates, and Top zips by fares.
When you have the answer open, tap the Pin button on the right hand side and select NYC Taxi to add it to the Liveboard.
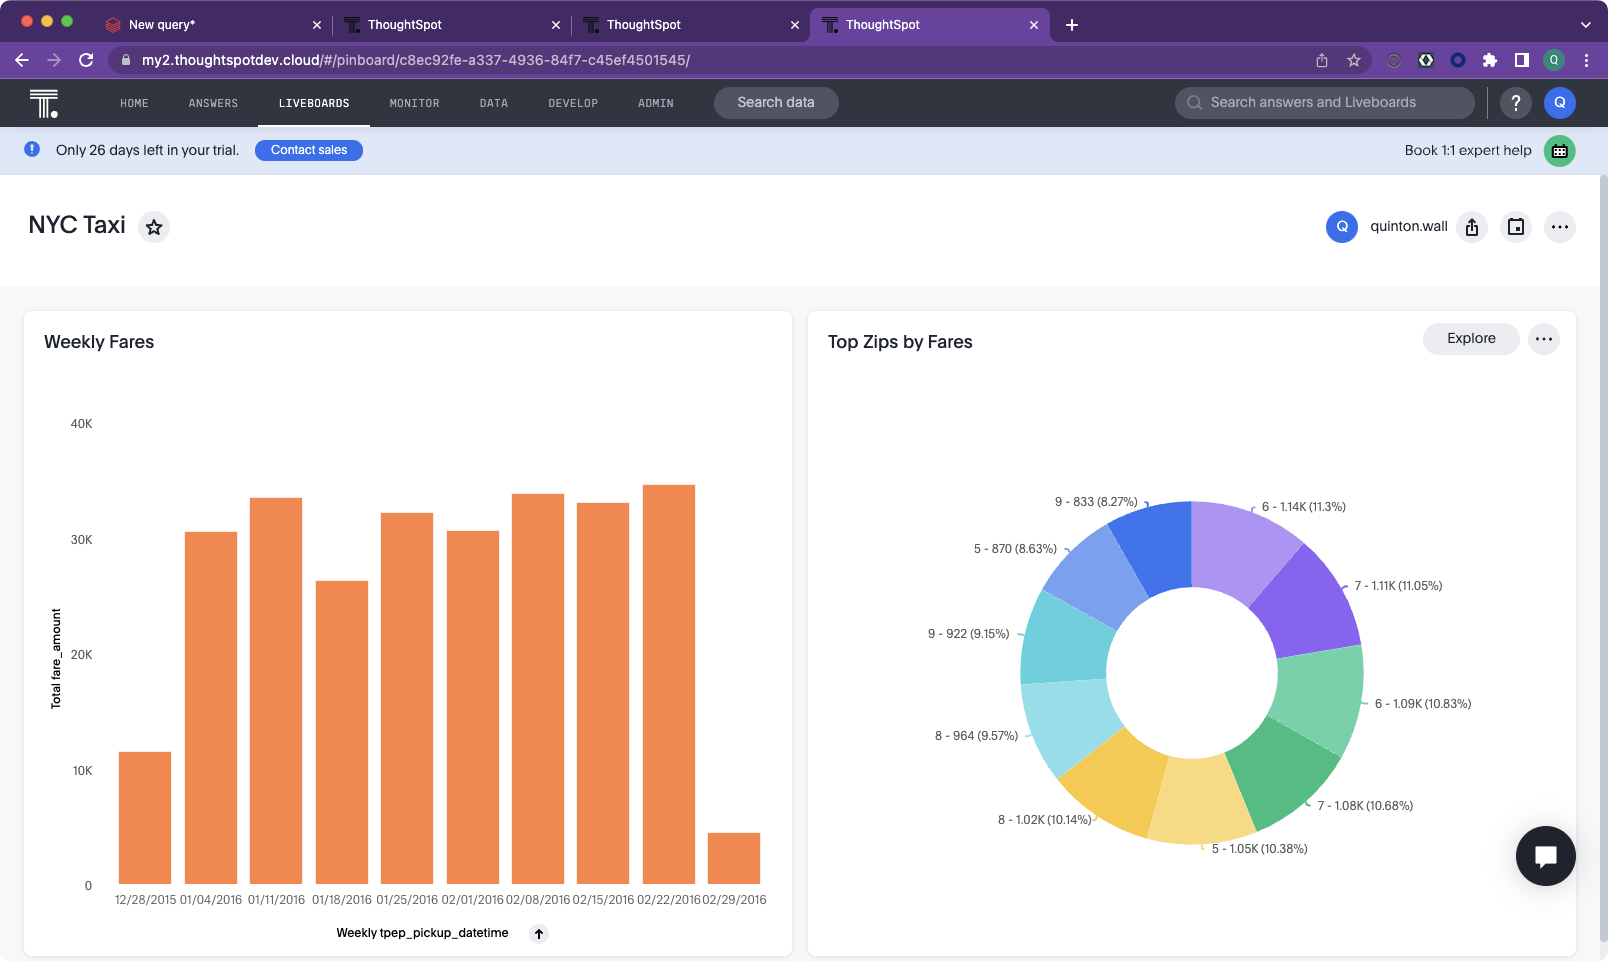
Navigating back to Liveboards, select NYC Taxi to show your combined Liveboard view. It looks great!
7. Embed Analytics
Duration: 0:20:00
Now that we have connected our data, searched to create answers, and created an interactive Liveboard, it’s time to embed this information into a web app. ThoughtSpot provides a suite of developer tools, APIs and SDKs called ThoughtSpot Everywhere. We are going to use the Visual Embed SDK to add our answers and Liveboards to a React-based web app.
To make things easy, we will use Code Sandbox, a web based IDE and runtime environment for building web apps. Using Code Sandbox means we don’t need to spend time configuring our local environment for React development. The good news is that ThoughtSpot Everywhere uses the languages and developer processes you already know and love. If you already have your local environment setup for React development, feel free to use that.
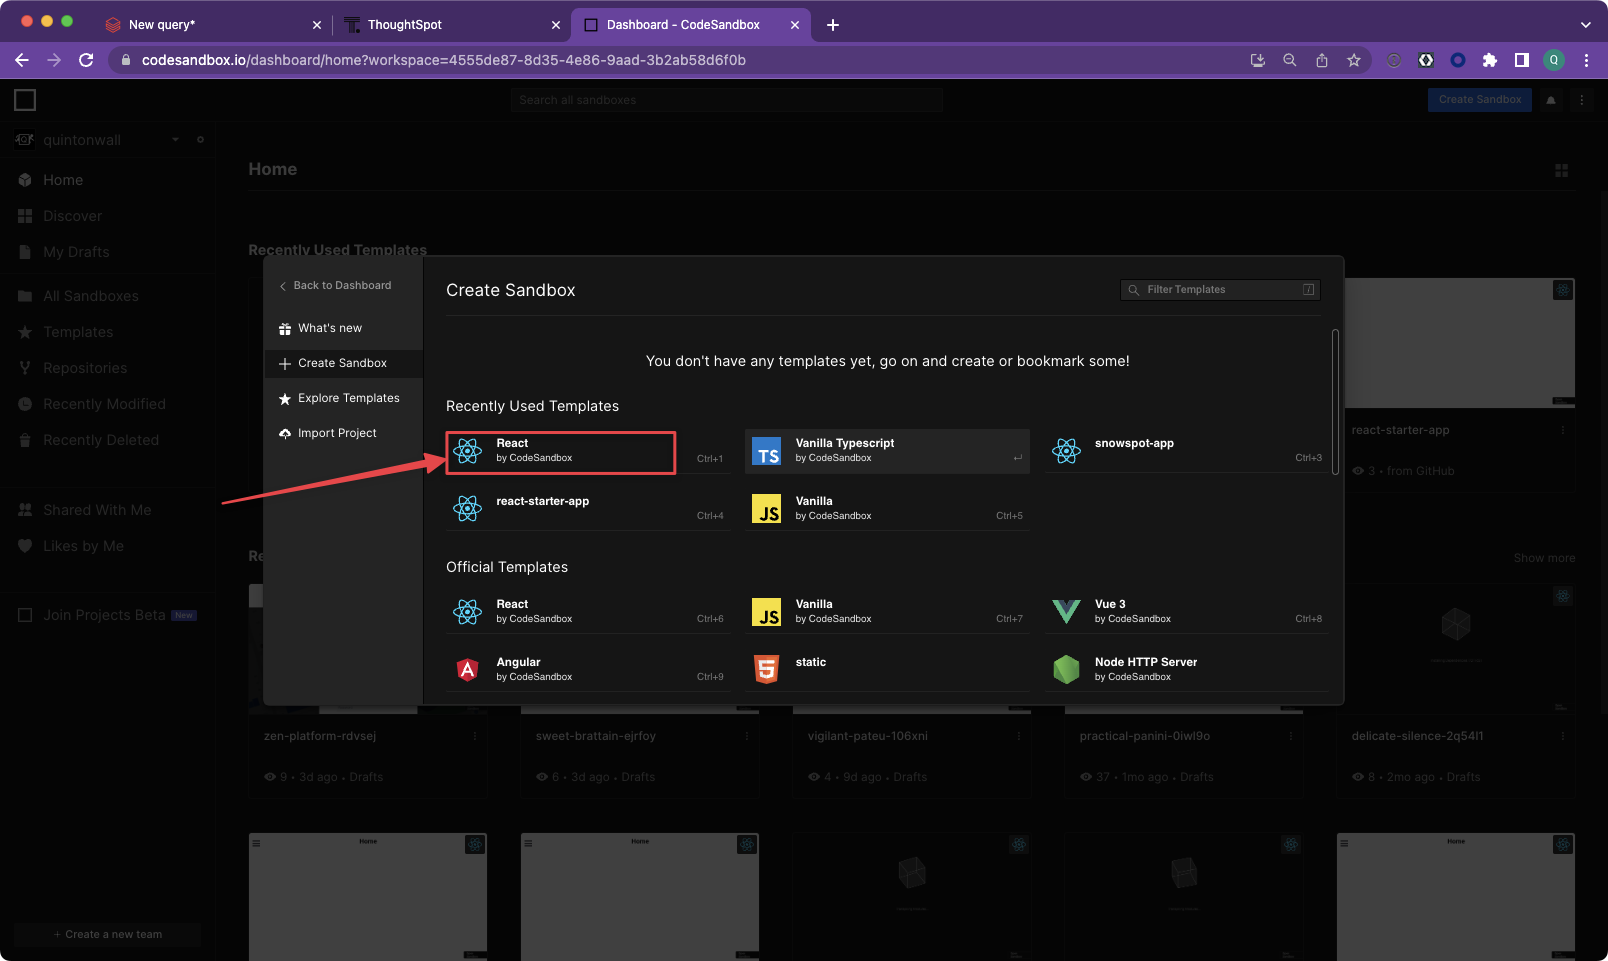
Set up your project
In your browser, go to codesandbox.io and tap the Create a Sandbox button on the top right of the page, then select the React template. This will create a very simple web app, with code on the left, and rendered page on the right.
Next, add the ThoughtSpot Visual Embed SDK as a dependency to your project. Type @thoughtspot into the dependency pane, then select the Visual Embed SDK from the autocomplete dropdown.
Now, replace the contents of App.js with the following code. Your ThoughtSpot trial URL may begin with my1.thoughtspot.cloud or my2.thoughtspot.cloud, so match it accordingly. Save your changes.
import "./styles.css";
import { init, AuthType } from "@thoughtspot/visual-embed-sdk";

init({
  thoughtSpotHost: "https://my1.thoughtspot.cloud",
  authType: AuthType.None
});

export default function App() {
  return (
    <div className="App">
      <h1>Hello ThoughtSpot Everywhere </h1>
      <p>This is a simple demo embedding ThoughSpot in a React App.</p>

    </div>
  );
}
You will notice that the code includes some logic to authenticate with ThoughtSpot. In this tutorial, we are using AuthType.None. This will prompt the user to log in when the page loads. This is fine for the tutorial, but not recommended for a production app. For a detailed overview of security options supported by the Visual Embed SDK, please check out the online documentation.
Embed the Search Component
Let’s embed one of the search answers we created earlier, Weekly Fares. Right click on the src folder in your project, and select New File. Call it SearchComponent.js. Then, add the following code and save your changes.
import { SearchEmbed } from "@thoughtspot/visual-embed-sdk/react";

export const SearchComp = () => {
  return (
    <SearchEmbed
      frameParams={{ height: "80vw" }}
      answerId={"YOUR-ANSWERID-HERE"}
    />
  );
};
The Visual Embed SDK comes with React components to make embedding analytics incredibly easy. In addition to React, you can use Typescript, Vanilla JavaScript, or other frameworks just as easily. The code should be pretty self-explanatory; the only thing we need to do is provide the SearchEmbed component a valid answerId so the SDK knows which answer it should render. The best place to get this answerId, and learn about all of the other configurable params embed components support is via the Developer Playground.
Within ThoughtSpot, tap the Develop tab on the top navigation, then select Playground. Once the Playground loads, choose Search as the feature to embed, and select Saved Search from the answers drop. Choose Weekly fares.
Once you select Weekly fares, you will see the code window automatically update with the answerId. Copy this into SearchComponent.js, replacing the YOUR-ANSWERID-HERE placeholder text.
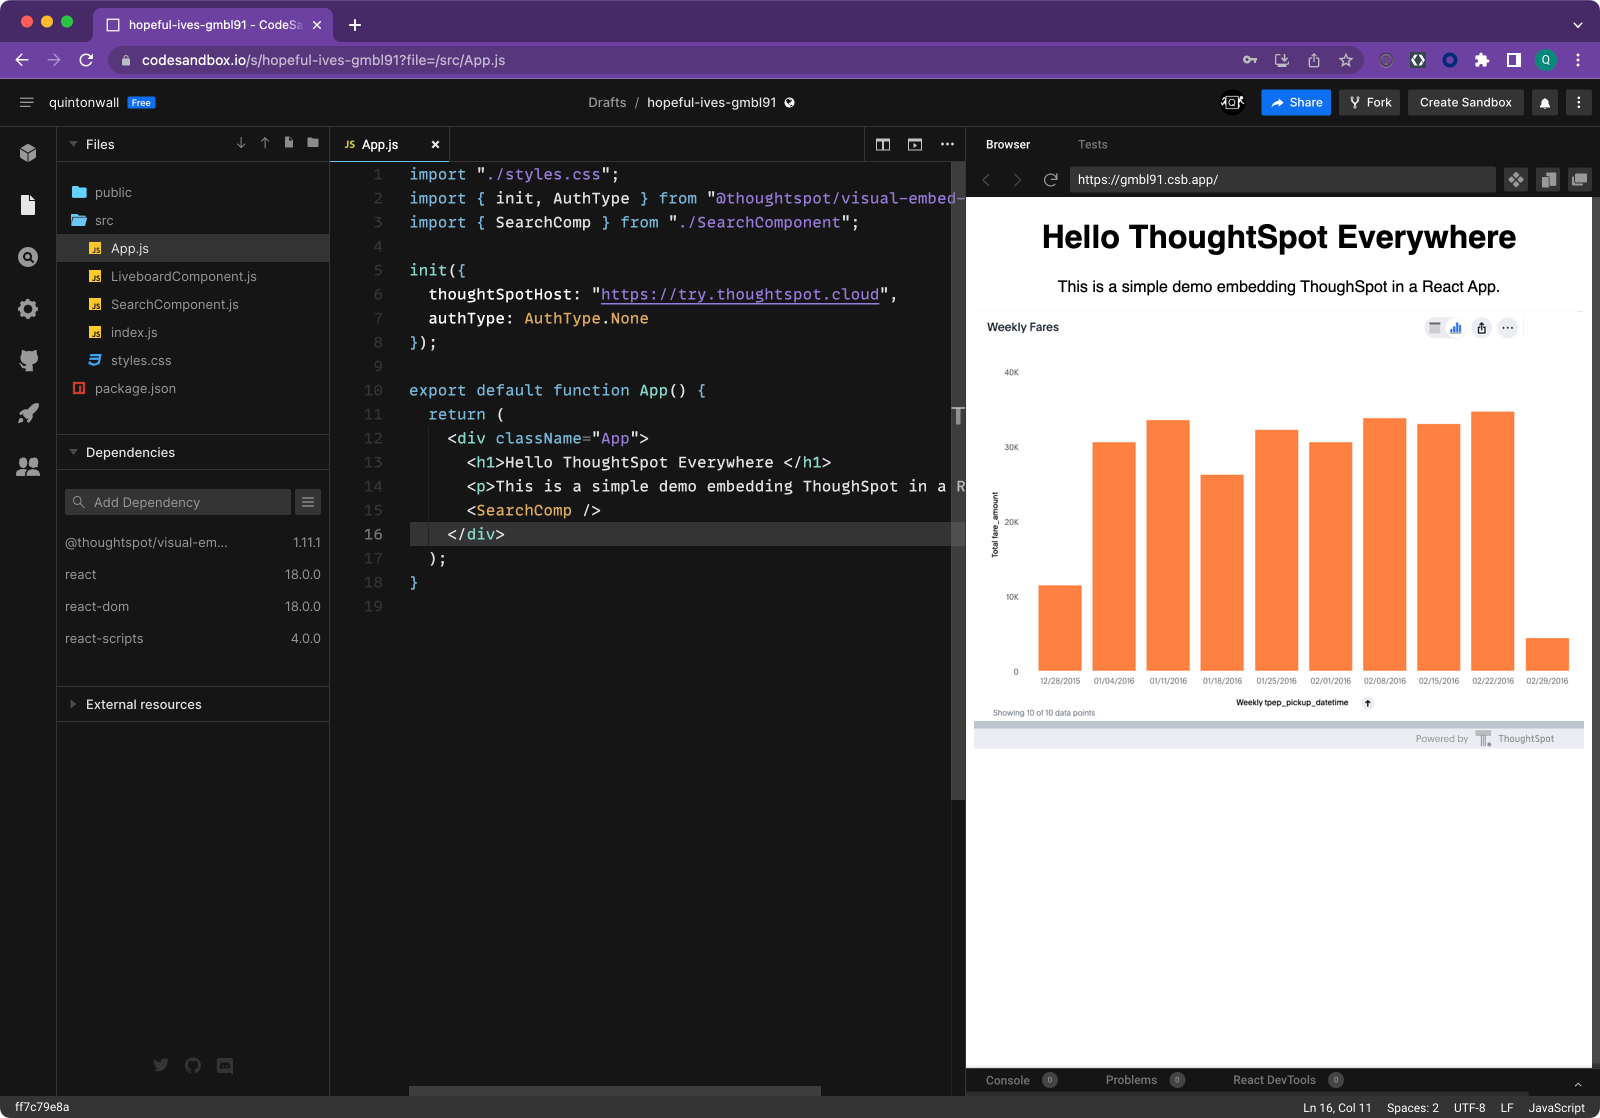
Next, update App.js to import the SearchComponent and render the results by adding the component within your App function:
import "./styles.css";
import { init, AuthType } from "@thoughtspot/visual-embed-sdk";
import { SearchComp } from "./SearchComponent";

init({
  thoughtSpotHost: "https://my1.thoughtspot.cloud",
  authType: AuthType.None
});

export default function App() {
  return (
    <div className="App">
      <h1>Hello ThoughtSpot Everywhere </h1>
      <p>This is a simple demo embedding ThoughSpot in a React App.</p>
      <SearchComp />
    </div>
  );
}
As soon as you save your changes, the right hand frame will reload prompting you to log into ThoughtSpot. Once authenticated your Search Answer will render. You can click and interact with the results drilling down to further uncover insights.
Embed the Liveboard Component
Embedding a Liveboard component is very similar to the Search component. Go ahead and create a new page in the src directory of your CodeSandbox project. Call it LiveboardComponent.js, and add the following code:
import { LiveboardEmbed } from "@thoughtspot/visual-embed-sdk/react";

export const LiveboardComp = () => {
  return (
    <LiveboardEmbed
      frameParams={{ height: "80vw" }}
      liveboardId={"YOUR-LIVEBOARDID-HERE"}
    />
  );
};
Just the same as with the SearchEmbed component, we need to replace the placeholder text with the actual liveboardId. You can retrieve this from the Developer Playground simply by changing the Select Feature to Embed dropdown to Liveboard, then choosing NYC Taxi from the list. The code block will automatically update with the correct liveboardId. Paste the liveboardId into your code and save your changes.
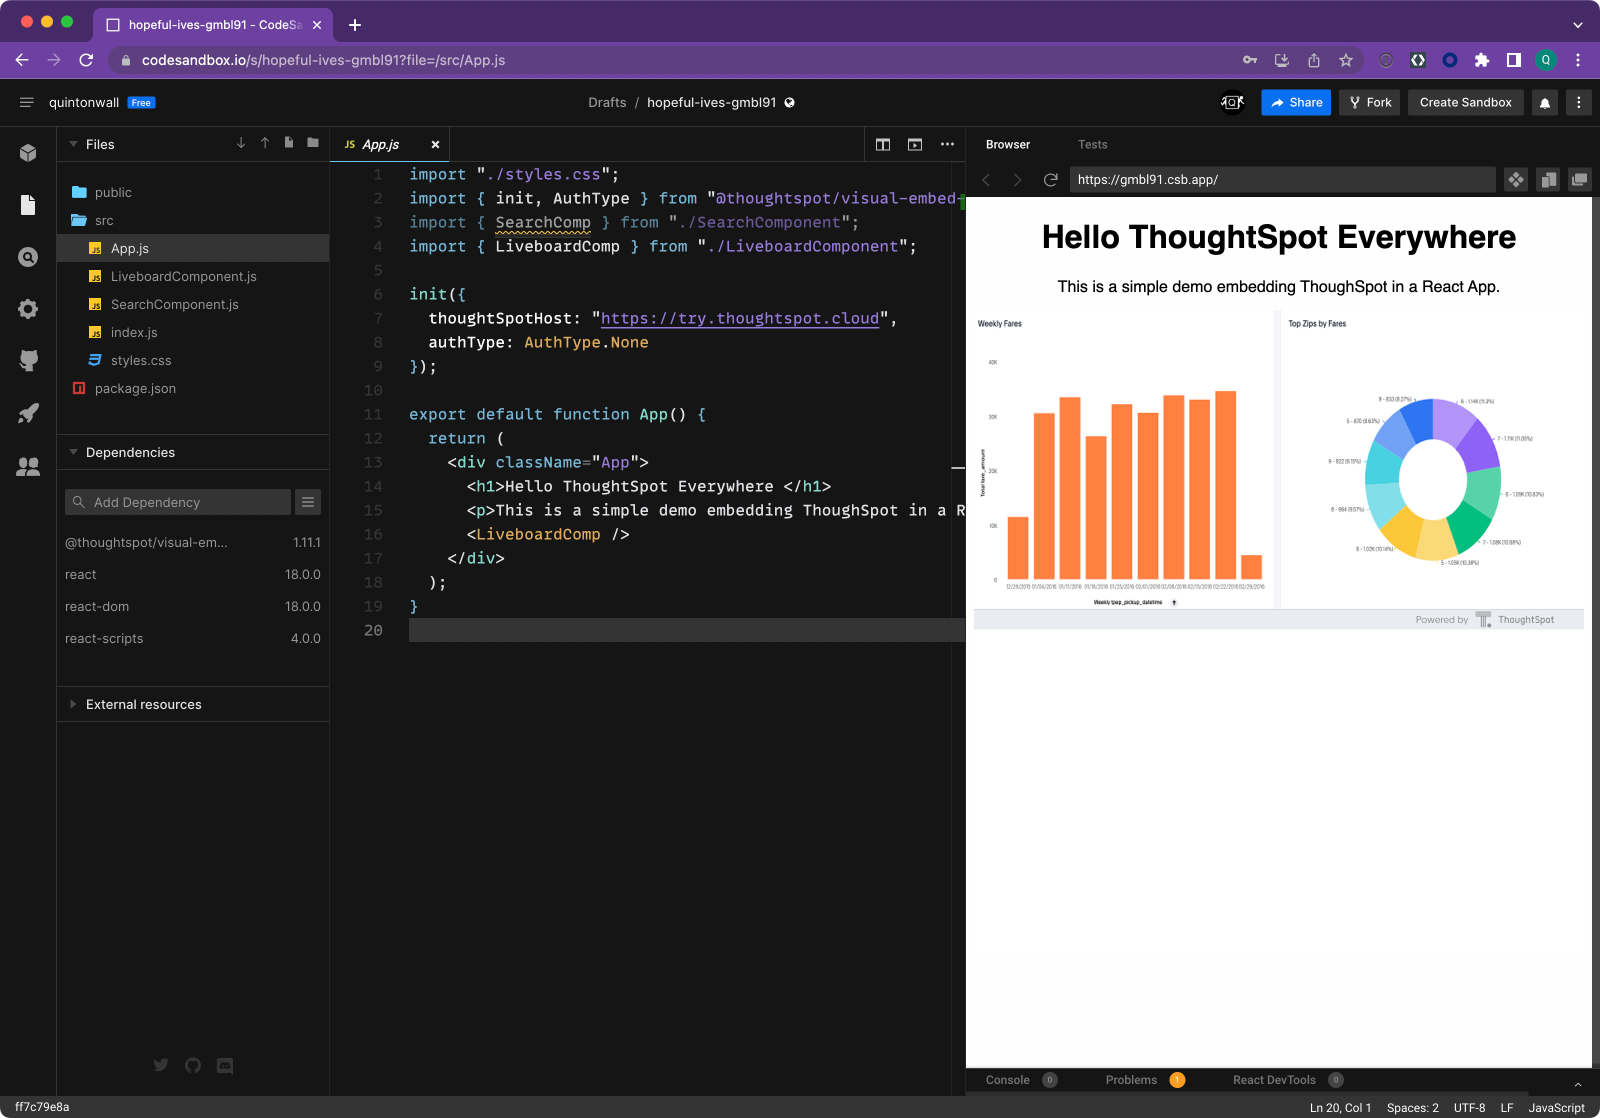
Then, modify App.js to import the LiveboardComponent and render that component instead of the SearchComponent. Your completed App.js should look similar to this:
import "./styles.css";
import { init, AuthType } from "@thoughtspot/visual-embed-sdk";
import { SearchComp } from "./SearchComponent";
import { LiveboardComp } from "./LiveboardComponent";

init({
  thoughtSpotHost: "https://try.thoughtspot.cloud",
  authType: AuthType.None
});

export default function App() {
  return (
    <div className="App">
      <h1>Hello ThoughtSpot Everywhere </h1>
      <p>This is a simple demo embedding ThoughSpot in a React App.</p>
      <LiveboardComp />
    </div>
  );
}
Save your changes, and the Liveboard will now render within your app. Great job!
8. Summary
Duration: 0:03:00
In this tutorial, you connected Databricks and ThoughtSpot to take advantage of the rich self-serve analytics tools to find answers from data, and created dynamic visualizations to allow users to derive further insights. Then, using ThoughtSpot Everywhere, you used the Developer Playground and the Visual Embed SDK to embed analytics into your web app. We’ve only scratched the surface of the features available to developers with ThoughtSpot Everywhere. To learn more and join other developers, make sure you check out developers.thoughtspot.com.