Customize layout and styles in the UI
Table of Contents
If you want to match the look and feel of embedded ThoughtSpot content with your core application, you can customize the ThoughtSpot application UI elements. Using style customization, you can create a uniform ThoughtSpot experience that complies with your company’s branding guidelines.
You can rebrand the ThoughtSpot interface elements such as the application logo, background color, and color scheme of visualizations.
|
Note
|
When you rebrand ThoughtSpot content, the UI styles are reset for all users. |
Style components🔗
You can customize the following ThoughtSpot UI style components:
Access customization settings🔗
To access style customization settings:
-
Log in to ThoughtSpot as an admin or a developer user.
-
To access the ThoughtSpot Developer portal, click Develop
-
Under Customizations, click Styles.
|
Note
|
Style customization settings are also available in the ThoughtSpot Admin tab. For more information on setting UI styles from the Admin tab, see Style Customization. |
Customize application logo and favicon🔗
To upload your application logos:
-
To access the ThoughtSpot Developer portal, click Develop.
-
Under Customizations, click Styles.
-
To upload the default logo:
-
Click Application Logo (Default).
-
Browse to your local directory and select a logo image.
Note-
The accepted file formats for the logo image are jpg, jpeg, and png.
-
The recommended size for the logo is 140px by 140px. For ThoughtSpot instances using the V3 navigation and home page experience (version 26.3.0.cl or later), the logo in the top navigation bar is constrained to 28px by 28px. For best results, upload a square logo that remains clear and visible when scaled down to 28px by 28px.
-
-
Verify if the logo appears correctly in the top left corner of the navigation bar.
-
-
To upload a wide logo:
-
Click the wide icon under Application Logo (Wide).
-
Browse to your local directory and select a logo image.
 Note
Note-
The application logo (wide) appears on the login screen.
-
The recommended size is 330px by 100px. This will allow the system to preserve the aspect ratio of the uploaded logo image and prevent distortion.
-
The accepted file formats for the logo image are jpg, jpeg, and png.
-
-
Verify if the logo appears correctly.
-
Customize fonts for visualizations🔗
You can add and edit fonts to customize the appearance of your charts and tables. You can set the default fonts of your system by customizing Chart Visualization Fonts and Table Visualization Fonts.
|
Note
| Before you begin, make sure you have the WOFF files available for the fonts you want to use. |
Important points to note🔗
-
To add a custom font, your font must be defined in a Web Open Font Format (
WOFF) file. -
Changes to chart and table defaults apply only to charts and features created after you configure a value.
-
If you change table fonts, older tables retain their previous fonts.
Update fonts🔗
To update fonts:
-
To access the ThoughtSpot Developer portal, click Develop
-
Under Customizations, click Styles.
-
To update fonts for charts, go to Chart Visualization Fonts, and select a chart label.
-
To update fonts for tables, go to Table Visualization Fonts.
By default, the font changes are applied to all values in the table cells.
-
To add a custom font, click +.
The system displays the Custom Font dialog.
-
Click the Custom Font field.
The system displays the file finder.
-
Add the
WOFFfile you want.The file appears in the font dialog.
-
Click Confirm.
-
To update the font style:
-
Click the edit icon.
-
Modify the font color, weight, and style.
-
Click Confirm.
-
Customize background color🔗
You can customize the application background color to match your company’s color scheme. The custom background color is applied to the application interface, embedded visualizations in Liveboards and answers.
To choose a background color for the ThoughtSpot application interface:
-
To access the ThoughtSpot Developer portal, click Develop
-
Under Customizations, click Styles.
-
Click the background color box under Embedded Application Background.
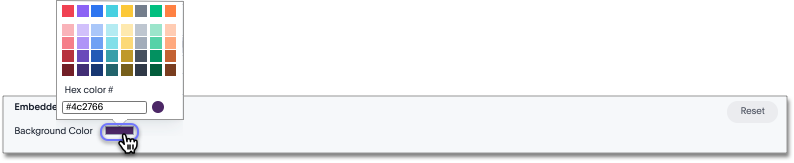
-
Use the color menu to choose your new background color.
You can also add a HEX color code.
Customize navigation panel🔗
If you have embedded the entire ThoughtSpot application in your app, you can customize the navigation panel color to match your company’s color scheme.
To choose a background color for the navigation panel:
-
To access the ThoughtSpot Developer portal, click Develop
-
Under Customizations, click Styles.
-
Click the background color box under Navigation Panel Color.
-
Use the color menu to choose your new background color.
You can also add a HEX color code.
Customize color palette for charts🔗
You can define a set of primary and secondary colors for chart visualizations. The customized color palette is used for all visualizations in Liveboards and answers.
How chart colors work🔗
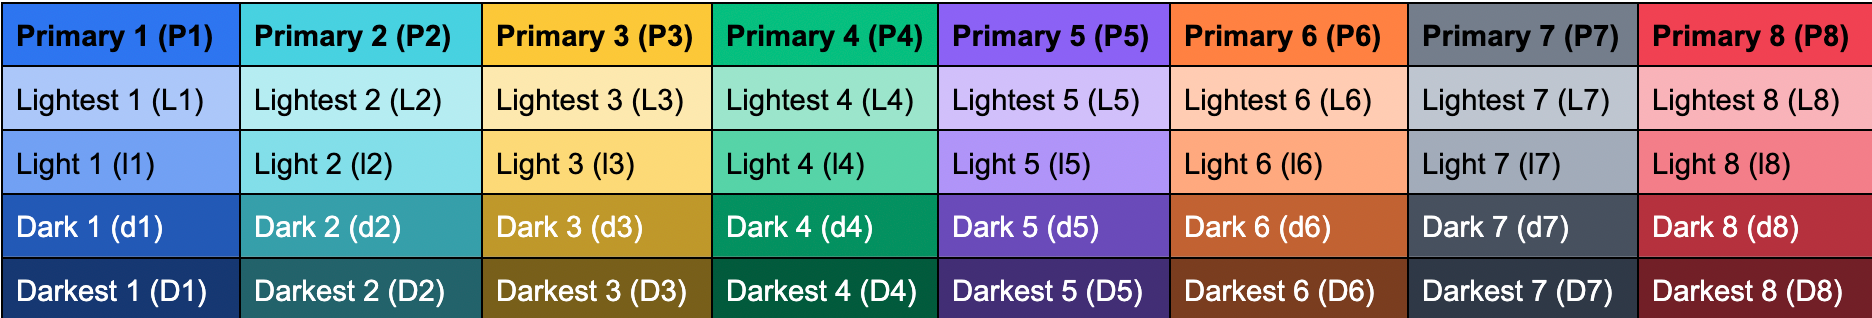
ThoughtSpot picks colors and hues in a specific order. For example, a primary color, lighter hue, and a hue that is darker than the primary color. The standard color palette in ThoughtSpot uses the following color format by default:
| Primary 1 (P1) | Primary 2 (P2) | Primary 3 (P3) | Primary 4 (P4) | Primary 5 (P5) | Primary 6 (P6) | Primary 7 (P7) | Primary 8 (P8) |
|---|---|---|---|---|---|---|---|
Lightest 1 (L1) | Lightest 2 (L2) | Lightest 3 (L3) | Lightest 4 (L4) | Lightest 5 (L5) | Lightest 6 (L6) | Lightest 7 (L7) | Lightest 8 (L8) |
Light 1 (l1) | Light 2 (l2) | Light 3 (l3) | Light 4 (l4) | Light 5 (l5) | Light 6 (l6) | Light 7 (l7) | Light 8 (l8) |
Dark 1 (d1) | Dark 2 (d2) | Dark 3 (d3) | Dark 4 (d4) | Dark 5 (d5) | Dark 6 (d6) | Dark 7 (d7) | Dark 8 (d8) |
Darkest 1 (D1) | Darkest 2 (D2) | Darkest 3 (D3) | Darkest 4 (D4) | Darkest 5 (D5) | Darkest 6 (D6) | Darkest 7 (D7) | Darkest 8 (D8) |
ThoughtSpot applies the same format for custom color palettes. To know more about the color selection algorithm and criteria for charts, see How chart colors work.
Define a custom color palette for charts🔗
To change the color palette for charts:
-
To access the ThoughtSpot Developer portal, click Develop
-
Under Customizations, click Styles.
-
Click the background color box under Chart Color Palettes.
-
Click the color you would like to change in the primary color palette, and use the color menu to choose your new color.
You can also add a HEX color code.
-
Click the color you would like to change in the secondary color palette, and use the color menu to choose your new color. You can also add a HEX color code.
The colors from the secondary color palette are used after all of the primary colors from the primary palette have been exhausted. Therefore, the secondary palette usually consists of secondary colors.
Configure color rotation🔗
If the chart requires only one color, ThoughtSpot selects a primary color depending on whether you enabled color rotation. The Color rotation feature determines whether single-color charts use a random primary color or always use the first primary color in the palette. If you enable Color Rotation, ThoughtSpot picks colors randomly and may choose any color from Primary 1 through Primary 6 in your color palette for single-color charts. If you disable Color Rotation, ThoughtSpot always chooses Primary 1.
If you disable color rotation, ThoughtSpot generates single-color charts in the order of your color palette, left to right.
Customize footer text🔗
You can customize the footer text in your ThoughtSpot instance to add your company-specific message.
To customize or rebrand the footer text, follow these steps:
-
To access the ThoughtSpot Developer portal, click Develop
-
Under Customizations, click Styles.
-
Click the text box under Footer text and enter the message.
Your custom message will appear in the footer.
Reset styles🔗
When you customize styles, the changes take effect after you refresh the browser.
To revert your changes, use the Reset button that appears when you move your cursor to the right of the style setting option.